
Comparisons: D'Hondt ~ Optimality 2
Comparative Optimality in Two- and Three-Party CHPV and D'Hondt Party-List Elections
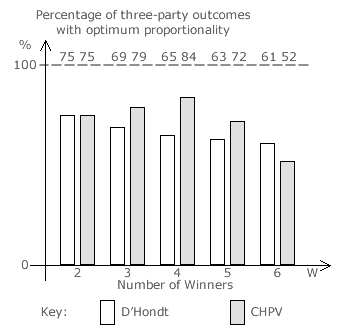
In the earlier Evaluations: Optimality of CHPV section, the proportion of CHPV outcomes with optimum proportionality in two-party and three-party elections is already established. These results can now be compared directly with those for D'Hondt optimality; see previous page. The bar chart below left presents a comparison between D'Hondt and CHPV for two-party elections and the one below right is for three-party elections.
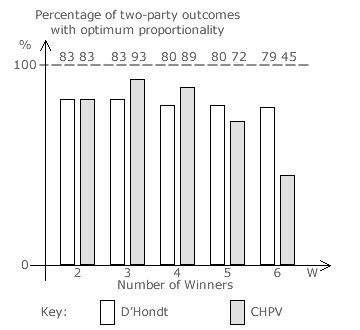
For two-party contests, both D'Hondt and CHPV produce optimally proportional outcomes in 83% or five out of every six possible election input profiles with two seats (W = 2). As extra seats are added, D'Hondt optimality declines slowly but for CHPV it rises initially before then dropping quickly. For three or four winners, CHPV performs better than the D'Hondt method. However, for five or more winners, the reverse is true. Note that with only two parties, the D'Hondt method has the same optimality as the Droop Quota.
For three-party contests, both D'Hondt and CHPV produce optimally proportional outcomes in 75% or three out of every four possible election input profiles with two seats (W = 2). Again, as extra seats are added, D'Hondt optimality declines slowly while for CHPV it drops quickly after initially rising. Here, for three, four and five winners only, CHPV performs significantly better than the D'Hondt method. Thereafter, D'Hondt outperforms CHPV. Note that with three parties, the D'Hondt method has a lower optimality than the Droop Quota.
The optimality of the D'Hondt method is significantly lower for three parties than for two. Optimality is always at a maximum with two seats (W = 2). It declines more quickly for three parties as extra winners are added. For three parties in comparison with just two, the optimality of CHPV is initially lower but beyond five winners it becomes higher. Optimality peaks with three seats (W = 3) for two-party CHPV elections but at four seats (W = 4) for three-party ones. It is only at and around these peaks that CHPV outperforms the D'Hondt method.
For up to five winners in two- or three-party contests, D'Hondt elections generate optimally proportional outcomes in over 60% of all possible cases but it is over 70% for CHPV elections.
Proceed to next section > Comparisons: D'Hondt ~ Party Cloning
Return to previous page > Comparisons: D'Hondt ~ Optimality 1