
Comparisons: D'Hondt ~ Maps 1
Two-Party D'Hondt Party-List Maps
Two-party maps contain all the possible election outcomes for a given number of winners in a two-party election. The maps for two parties A and B contesting up to six vacancies in closed D'Hondt Party-List elections are shown below. Recall that the actual per-unit tally shares for A and B are represented by the appropriate point along the line. The domain boundaries of an optimally proportional voting (OPV) system are indicated by the dotted markers underneath the line. These optimal boundaries are necessarily midway between the dots that represent perfect proportionality between the outcome seat share ratio (as stated underneath the dot) and the tally share ratio (point on the line) as defined by the voters.
The boundaries for the D'Hondt method domains are determined by the various two-way critical ties that may occur in elections with W winners. For the specific details of how party stick diagrams are used to deduce the position of these boundaries, please refer to the Map Construction appendix for the Two-Party D'Hondt Method Maps page.
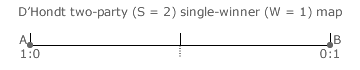
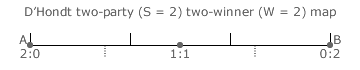
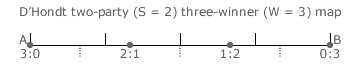
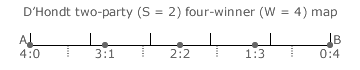
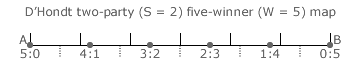
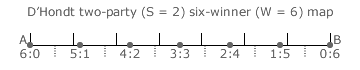
For all points along the line that are in the same D'Hondt and OPV domains the outcome is optimally proportional. For all points in dissimilar domains the outcome is not optimal. For D'Hondt domains, notice that there are W+1 of them and that they are all of equal length; namely 1/(W+1). For OPV domains, the two end ones are each half the length of the other domains. Counting these two half-length domains as just one full-length one, there would then be W domains of full-length 1/W.
It is this difference in domain length that accounts for the mismatch between the D'Hondt and OPV domain boundaries. Two corresponding boundaries are at their closest in the centre of the map but steadily diverge as they approach either end of the map. At the very end of a map, the two corresponding boundaries are however necessarily equal as the domains terminate here. Therefore, the D'Hondt method is more likely to produce an optimally proportional outcome when the two parties have comparable rather than dissimilar levels of support. This feature is largely independent of the number of seats available.
As the number of winners increases, extra domains and boundaries appear on the map. With more boundaries, there are more portions along the map where points relate to dissimilar domains. However, with more domains, these portions are smaller in length. The net effect of these two conflicting features is that the optimality of two-party D'Hondt Party-List elections deteriorates slowly as the number of winners increases; see the next section.
Despite the D'Hondt method being a highest averages version of the party-list system and the previous Droop Quota being a largest remainder one, their respective two-party maps for the same number of seats/winners are identical. However, this equivalence does not apply to maps with more than two parties; see the next two pages.
Proceed to next page > Comparisons: D'Hondt ~ Maps 2
Return to previous page > Comparisons: Party-List ~ D'Hondt