
Evaluations: CHPV Maps 1
Party-List CHPV Elections
For a truly proportional result, those elected in a multiple-winner contest would accurately reflect the preferences of the electorate as a whole. The spectrum of opinions of the elected members in both nature and extent would be identical to those of the voters. The only difference would be that the number of elected members (winners) would be a smaller and more manageable number. In other words, the elected subset would be fully representative of the whole.
Can party-list CHPV in multiple-winner elections produce such a representative outcome? If so, how accurately can those elected reflect the party preferences of the voters? Inevitably, there will be rounding difficulties when choosing a subset with a fixed number of winners so only optimum proportionality rather than prefect proportionality is potentially achievable in practice. Therefore, how does CHPV compare with an Optimally Proportional Voting (OPV) system? Before addressing this issue directly, some multiple-winner maps for party-list CHPV must first be presented.
Two-Party Multiple-Winner CHPV Elections
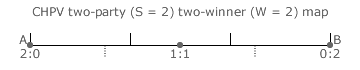
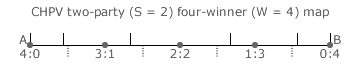
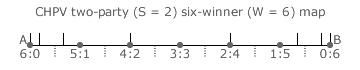
Two-party maps that contain all the possible election outcomes for a given number of winners are introduced in the previous section. The maps for two parties A and B contesting up to six vacancies in party-list CHPV elections are shown below. Recall that the actual per-unit tally shares for A and B are represented by the appropriate point along the line. The boundaries of the OPV domains are indicated by the dotted markers underneath the line. These optimal boundaries are necessarily midway between the dots that represent perfect proportionality between the outcome seat share (as stated underneath the dot) and the tally share (point on the line) as defined by the voters.
The boundaries for the CHPV domains are determined by the various two-way critical ties that may occur in elections with W winners. For the specific details of how party stick diagrams are used to deduce the position of these boundaries, please refer to the Two-Party CHPV Maps page in the Map Construction appendix. These boundaries are shown as full markers above the linear map.
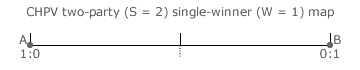
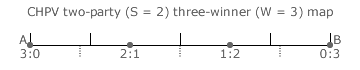
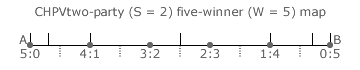
For all points along the line that are in the same CHPV and OPV domains the outcome is optimally proportional. For all points in dissimilar domains the outcome is not optimal. For an odd number of winners (left-hand maps), notice that the match between the CHPV and OPV domains is perfect for a single winner, close for three winners but poorer for five winners.
Consider what happens when two extra winners are increasingly added. For the OPV domains, they get smaller in range but they remain evenly spread along the line and equal in length. However, for the CHPV ones, the two extreme domains are each simply divided into two new domains every time that two extra winners are added. All the other domains remain fixed in size and location. The same applies for an even number of winners; see right-hand maps. It is therefore clear that as more winners are added to two-party contests an increasing number of outcomes are not optimally proportional.
Indeed, even perfect proportionality between party tally share and party seat share may not be achieved when there are a large number of winners. Consider the case where there are six winners (W = 6) and the tally share is exactly 5:1. The ideal seat share is clearly also 5:1. However, the 5:1 dot on the map is in the 4:2 CHPV domain and the outcome is hence neither perfect nor optimal. For less than five winners, all dots are within their correct CHPV domains. For five winners, two dots (4:1 and 1:4) coincide with a CHPV domain boundary and a perfect outcome is dependent on a random tie-break. Increasingly, for more than five winners, some dots appear in an inappropriate CHPV domain.
Proceed to next page > Evaluations: CHPV Maps 2
Return to previous page > Evaluations: Diagrams & Maps 5