Evaluations: Introduction (Party-List)
Party-List CHPV Elections
Elections where numerous winners are elected are generally those where some degree of proportionality is desired. A multiple-winner CHPV election is no exception. Formally, it can be categorised as a party-list voting system that employs the 'highest averages' approach to seat allocation based on divisors that form a geometric sequence of increasing powers of two (1, 2, 4, 8 and so on). Alternatively, seat allocation can be viewed as being based on multipliers that form a geometric sequence of decreasing powers of two (1, 1/2, 1/4, 1/8 and so on). Dividing by two is the same as multiplying by one half. The former viewpoint is the traditional one but the latter perspective is clearly more meaningful here as it explicitly relates to CHPV and its weightings.
With party-list CHPV, the top-ranked party candidate has a tally equal to the number of votes received by that party and each consecutive candidate on the party list is awarded half the tally that the preceding (higher-ranked) one is given. Seat allocation using the highest averages approach is explained in more depth in the later Comparisons: Party-List section where it is compared to the alternative 'largest remainder' method.
For any party-list election with W winners, each party submits its list of up to W candidates for the election and each voter then casts a vote for the party of their choice. This list may be 'free', 'open' or 'closed'. A closed list means that voters have no ability to alter the candidate rankings on the list issued by the party while a free list gives them complete control over the rankings of the party-nominated candidates. An open list allows some degree of voter modification of the rankings issued by the party.
For the sharing of seats amongst the parties on the basis of their vote shares, the multiple-winner CHPV algorithm is necessarily based on a nominal or actual closed list to determine the number of seats won by each party. For each party, the selection of the actual candidates to fill its seats may then be determined by its own supporters using a free list. For example, ranked ballot CHPV could be employed to rank the candidates on each party list.
In order to aid the analysis of these more complex multiple-variable elections, two types of visual evaluation tools are first introduced. A party stick is employed to represent the individual candidate tallies for a party. Stick diagrams are extremely useful in identifying critical and non-critical ties between two or more candidates in multiple-party multiple-winner elections. Visual multi-party maps are employed to display all the possible outcomes of a given election in terms of both party tally shares and their resultant seat shares. Two-party (linear) maps and three-party (triangular) maps are extensively used here. They are partitioned into various domains where all identical seat share outcomes are grouped together in the same domain. The critical two-way and three-way candidate ties for an election are crucial in determining the boundaries of these domains.

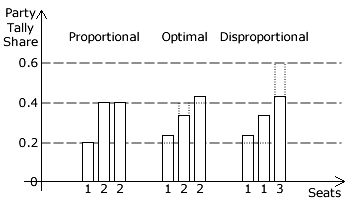
Using these and other techniques, it is possible to assess the proportionality of any outcome. For the three-party five-winner election opposite, the left-hand example shows a truly proportional outcome. Each of the five seats is worth 1/5 or 0.2 of the overall tally so each party has its exact fair share of seats for votes cast. This rarely occurs as some rounding up or down is generally inevitable. Hence, in practice, an optimum outcome is often the best one that can be achieved. The central example shows such an outcome as the magnitudes of the discrepancies (indicated by the dotted lines) are at a minimum when totaled. An outcome may not be optimal but could be significantly disproportional; as in the right-hand example. Despite the tally shares remaining unchanged, the different allocation of seats has increased the sum of the discrepancy magnitudes.
The proportion of all possible election outcomes that result in an optimum sharing of seats is called the optimality of the voting system. The optimality of CHPV is comprehensively covered in the following evaluations. Although an Optimally Proportional Voting (OPV) system has an optimality of 100%, it nevertheless has inherent difficulties in tackling the problem of strategic nominations. When assessed against the benchmark of OPV, CHPV is significantly less vulnerable to cloning by parties seeking an unfair advantage in seats.
The extent of the disproportionality in various sets of CHPV election outcomes is also evaluated in this chapter. Unusually for a party-list method, the proportionality of CHPV has a 'peaked' response in terms of the number of vacant seats being contested and the number of parties competing to fill them. For maximum party proportionality, there is an optimum number of winners for a given number of parties. It is around these peaks that party-list CHPV performs well in comparison to some of its other rival voting systems.
Proceed to next section > Evaluations: Diagrams & Maps
Return to previous page > Evaluations: Summary (Ranked Ballot) 2
