
Evaluations: Optimality of CHPV 1
Proportion of Optimal Outcomes in Two- and Three-Party Multiple-Winner CHPV Elections
On the two-party and three-party maps in the previous section, the CHPV domain boundaries are shown as full lines while those of an Optimally Proportional Voting (OPV) system are shown as dotted lines. An OPV system is one where the sum of the magnitudes of the differences between the tally share and seat share for each party is always minimal for any election outcome. In other words, any tally share point within an OPV domain is closest to the seat share dot in the centre of that domain than to any other domain centre.
When the tally shares for any election generate identical seat shares whether the CHPV or OPV system is used, then CHPV here yields optimally proportional results. On the maps, these results occur when the CHPV seat share domains overlap with their equivalent OPV ones. On the remaining parts of the maps where the CHPV and OPV domains generate dissimilar seat share outcomes, then CHPV does not produce optimally proportional results.
Therefore, the proportion of optimal outcomes for party-list CHPV can be expressed as the ratio of those parts of a map that do generate an optimal outcome relative to the map as a whole. As both the CHPV and OPV domain boundaries are precisely positioned on the maps, an accurate ratio for any map can be derived by calculating and then summing the relevant areas on a three-party map or the relevant lengths on a two-party map.
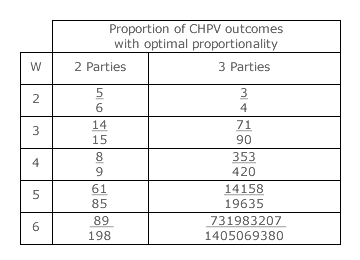
The table above provides the exact fractional proportion of optimal CHPV outcomes for two- and three-party elections with up to six winners (W).
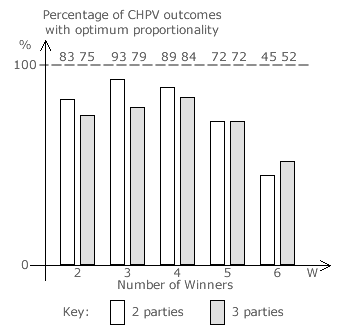
The bar chart opposite illustrates these same proportions as percentages rounded to the nearest integer.
[Note: For the three-party map, both the whole area and any component part can be expressed as an exact fraction times the square root of three (√3). When the ratio is calculated, the √3 surd in the numerator and denominator cancel each other out leaving an exact fraction as the answer.]
For a given multiple-party multiple-winner election, the proportion of all possible outcomes that result in optimum proportionality is called the optimality of the voting system. For two-party CHPV contests, optimality is highest with three winners but it declines fairly sharply as the number of seats increases thereafter. For three-party elections, optimality is highest with four winners but it too declines quickly as the number of seats rises further. However, for up to five winners, both two- and three-party CHPV elections generate optimally proportional outcomes in over 70% of all possible cases.
Proceed to next page > Evaluations: Optimality 2
Return to previous page > Evaluations: CHPV Maps 3