
Comparisons: Party-List 1
Description of the Party-List Voting System
The party-list method is designed to be used in multiple-winner elections where reasonable proportionality between votes cast and seats won for the multiple parties is of crucial importance. Here, a vote is cast by each voter for one specific party and its party list. The list ranks the candidates for this party in the order of preference chosen by that party. For a multiple-winner election with W seats, each party may include up to W candidates on its party list. After the votes have all been counted, each party receives a similar share of the seats to its share of the votes. If a party is awarded one or more seats, then its top one or more candidates on the party list are elected to fill these vacancies.
There are many variants of the party-list method and they differ from each other with regard to how they relate seat share to vote share. They can be categorised into two approaches; namely, the largest remainder methods and the highest averages ones. Each is outlined below in this section. The Hare Quota and the Droop Quota variants are the two most common largest remainder methods. The D'Hondt and the Sainte-Laguë variants are the two most common highest averages methods. These four variants are analysed and compared to CHPV (a highest averages method) in great detail in the subsequent sections of this chapter.
Also, the party list itself may be closed, open or free. Respectively, voters have no, limited or full influence over the ranking of the candidates on the list for the party they support. As with the earlier evaluation of party-list CHPV and in the absence of any knowledge of voter preferences for individual candidates, all subsequent analysis and comparisons are based on closed lists. For a detailed and comprehensive outline description of the party-list method and the various types of party lists, please visit the voting system section of Wikipedia or another reference source.
Largest Remainder Method
To illustrate the general party-list approach using a largest remainder method, consider a three-party three-winner election where the tally (vote) shares for parties A, B and C are 13/24, 8/24 and 3/24 respectively. Different variants will use a different quota for allocating seats to votes cast. In this general example, a tally share quota of one quarter (1/4) of the vote is adopted. A winning tally share needs to be over (and not just equal to) this fraction. With three vacant seats on offer (W = 3), this quota threshold (t > 1/4) ensures that no more than three seats are ever awarded.
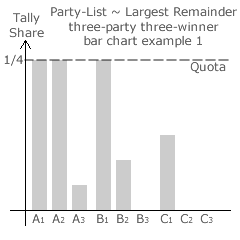
Any tally share in excess of the fractional quota is transferred to the next lower-ranked candidate on the party list. Note that the top-ranked party A candidate (A1) has an excess of 13/24 - 1/4 or 7/24; see the bar chart opposite. This excess is transferred to A2 who then still has an excess; namely 7/24 - 1/4. This excess of 1/24 is finally transferred to A3.
The top-ranked party B candidate (B1) also has an excess and the excess share of 8/24 - 1/4 or 2/24 is transferred to B2. At 3/24, C1 has no excess. Being too low on their party list given the support awarded to each party, candidates B3, C2 and C3 have no share of the overall tally. All the candidates that do exceed the quota are elected so A1, A2 and B1 each win one of the three available seats here.
As always, notice that the sum of the (per-unit) tally shares is necessarily equal to one (6/24 + 6/24 + 1/24 + 6/24 + 2/24 + 0 + 3/24 + 0 + 0 = 1).
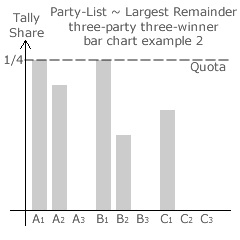
In the event that a seat remains to be filled, the candidate with the largest remaining tally share is also elected. Hence this method is given the name largest remainder. In a second example, the tally (vote) shares for parties A, B and C are now 11/24, 9/24 and 4/24 respectively. The new tally shares for each candidate are shown in the bar chart opposite.
Candidates A1 and B1 are elected as their tally shares exceed the quota but there is still one remaining seat to be filled. As A2 has the largest remaining tally share (11/24 - 1/4 or 5/24) compared to B2 (with 9/24 - 1/4 or 3/24) and C1 (with 4/24), then this candidate is also elected.
Two or more candidates can however be critically tied on the same tally share. It is precisely these two-way and three-way ties that determine the boundaries for the seat share domains on a specific map. By using bar charts to identify every possible critical tie, the map for any two- or three-party W-winner election using a largest remainder method such as the Hare Quota and Droop Quota ones can be constructed.
Proceed to next page > Comparisons: Party-List 2
Return to previous page > Comparisons: Single Transferable Vote 2