
Comparisons: D'Hondt ~ Party Cloning 1
Susceptibility of D'Hondt Party-List Elections to Party Cloning
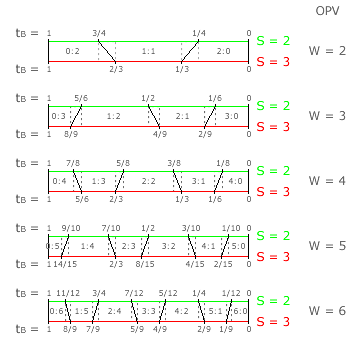
Party cloning threshold figures are introduced in the earlier Evaluations: Party Cloning section where the figures for CHPV are evaluated against those for an optimally proportional voting (OPV) system. The relevant threshold figures for the D'Hondt method are derived using the same methodology as explained in this earlier section. For up to six winners, the benchmark OPV figures are repeated below left and the corresponding figures for the D'Hondt method are shown below right.
To recap, the green line is the two-party map for parties A and B. The red line is the 1:1 two-way tie line for parties B1 and B2 on the three-party map for A, B1 and B2. The ranges of the tally shares for party A (tA) that produce a different seat share for A:B (as stated in each domain) after party B clones itself into parties B1 and B2 are highlighted in white.
Any particular tally share threshold for party B may rise, fall or remain unchanged following its cloning attempt. Where it is a rise, party B succeeds only in harming its own chances. The black line within any white area indicates the change in the tally share threshold needed to maintain the (critical-tie) boundary between the two relevant seat share domains. It has a positive gradient for a rise in this threshold. Where it is a falling threshold, party B gains an unfair advantage over A. The black line now has a negative slope.
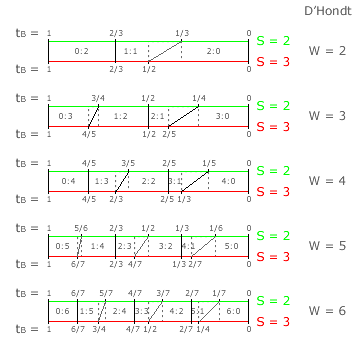
Regardless of the number of winners (W) in the D'Hondt party-list election, it is immediately obvious that cloning by party B has no detrimental effect on party A. Each seat share threshold for party B is either unchanged by the cloning or it moves such that B inflicts harm on itself. In this election scenario, the D'Hondt method is hence not vulnerable to party-cloning strategic nominations.
The D'Hondt method is similar to the Droop Quota in that both are invulnerable here to party cloning and both fail to achieve 100% optimality. However, the D'Hondt method has a poorer optimality than the Droop Quota for more than two winners; see previous sections. This is due to the seat share domains being regular hexagonal shapes for any largest remainder method (such as the Hare or Droop Quota) but being irregular ones for any highest averages method (such as the D'Hondt method); see the relevant three-party maps and compare their domains.
Proceed to next page > Comparisons: D'Hondt ~ Party Cloning 2
Return to previous page > Comparisons: D'Hondt ~ Optimality 2