
Comparisons: D'Hondt ~ Proportionality 2
Voting System Least Squares Index for the D'Hondt Method
Once the domain centres are identified, the centre offset least squares index (LSIj) for each D'Hondt domain can then be calculated. Each party seat share and party tally share should be expressed as a per-unit value (one ranging between 0 and 1). Once calculated, the voting system least squares index (LSIVS) for D'Hondt can be determined for a given number of competing parties and vacant seats. The bar chart below shows the LSIVS for a D'Hondt election with up to six parties (S) and up to eight winners (W). Remember that as a measure of disproportionality, any LSI should be as low as possible for maximum proportionality.
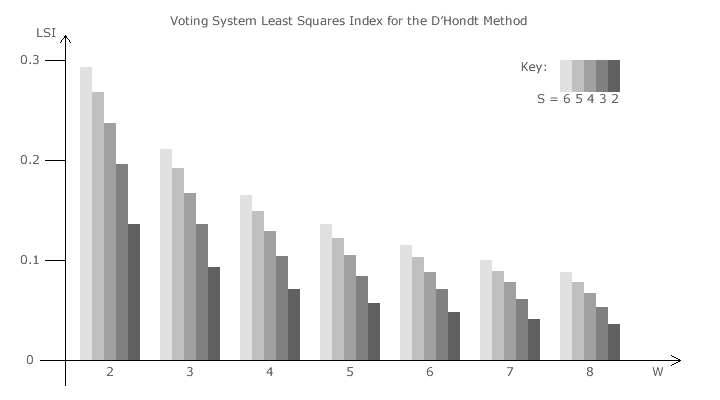
For D'Hondt elections, it is clear that disproportionality declines as the number of winners is increased; regardless of how many parties compete in them. This is simply due to the number of domains increasing and their size decreasing. With smaller domains, their centres are offset less from the point of perfect proportionality. The proportionality of D'Hondt elections does vary significantly with the number of parties nominating candidates but this effect reduces with an increasing number of winners.
Therefore, maximum proportionality is obtained by having just one constituency containing all the seats within it. For national, regional or other wide-area bodies, the electorate may be divided into a number of smaller and more local constituencies with a representative number of seats in each. Winners can then better represent their local area at the wide-area level. However, by doing so, the overall outcome of the election will be somewhat less proportional.
For two parties, the proportionality of multiple-winner D'Hondt elections is identical to that for Droop Quota elections. However, for more than two parties, party-list D'Hondt elections are consistently less proportional than Droop Quota ones; see the earlier Droop Quota ~ Proportionality section.
Proceed to next page > Comparisons: D'Hondt ~ Proportionality 3
Return to previous page > Comparisons: D'Hondt ~ Proportionality 1