
Comparisons: Droop Quota ~ Maps 3
Three-Party Droop Quota Party-List Elections (continued)
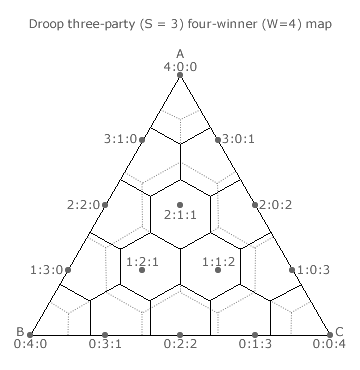
Like the OPV ones, the striking feature of Droop Quota domains is that they are also in whole or in part regular hexagons. The Droop Quota domains are however smaller in size than the OPV ones. For Droop Quota domains, the ones truncated by an edge are 5/6 the area of the full hexagon. For those truncated by two edges (the three apex domains), the area is 4/6 of a hexagon. In contrast, for OPV domains, the edge and apex ones are 1/2 and 1/6 the area of the untruncated inner domains respectively.
It is this difference in domain size that accounts for the mismatch between the Droop Quota and OPV domain boundaries. Two corresponding hexagonal boundaries are at their closest in the centre of the map but steadily diverge as they approach an apex of the map. At the edges of a map, the two corresponding boundaries are however necessarily equal as the domains terminate here. Therefore, the Droop Quota method is more likely to produce an optimally proportional outcome when the three parties each have comparable rather than dissimilar levels of support. This feature is largely independent of the number of seats available.
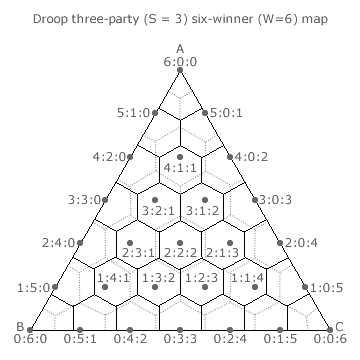
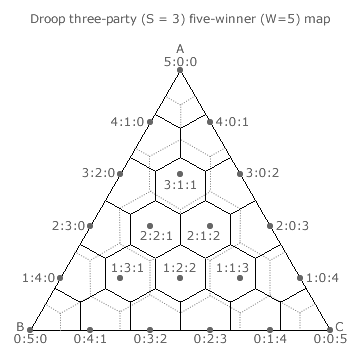
As the number of winners increases, extra domains and boundaries appear on the map. With more boundaries, there are more portions within the map where points occur in dissimilar domains. However, with more domains, these portions are smaller in area. As for the two-party ones, the net effect of these two conflicting features is that the optimality of three-party Droop Quota Party-List elections deteriorates slowly as the number of winners increase; see next section.
Proceed to next section > Comparisons: Droop Quota ~ Optimality
Return to previous page > Comparisons: Droop Quota ~ Maps 2