
Comparisons: Party-List 2
Highest Averages Method
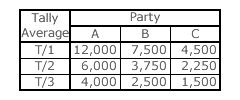
This alternative approach to the party-list system is based on how many voters each winning candidate represents on average. As an example, consider a three-party three-winner election with 24,000 voters. Parties A, B and C respectively receive a tally (T) of 12,000, 7,500 and 4,500 votes each; see table opposite.
If the parties are awarded one seat each, then the top-ranked candidate from each party would represent 12,000, 7,500 and 4,500 voters respectively. This is clearly not a proportional sharing of seats.
If party A (with the largest support) is given two seats, then each of its two winning candidates would represent an average of 12,000/2 or 6,000 voters. If it was instead awarded three seats, each victor would represent 12,000/3 or 4,000 voters on average. The same averages can also be calculated for the other two parties; see table. The optimum solution to the allocation of seats is to elect those candidates who would represent the most voters on average. Therefore, with three vacant seats, the three highest averages in the table (highlighted in white) determine which candidates are elected. Here, the two top-ranked candidates of party A and the prime candidate of party B are hence elected.
In this general three-winner example, the tally (T) for each party is divided by 1, 2 and 3 to calculate its three averages. For an election with W seats, W averages for each party need to be calculated. Also, the different variants of the highest averages method use different divisors to establish different averages. The variant devised by D'Hondt uses the divisors 1, 2, 3, 4, 5 and so on. In contrast, the one devised by Sainte-Laguë uses the divisors 1, 3, 5, 7, 9 and so on instead. See the later sections of this chapter for a detailed analysis. Others sequences of divisors are also valid. Although any calculated quotients are still referred to as 'averages', they can in fact appear to become unrelated to the number of voters each victor represents.
When employed in multiple-party multiple-winner elections, CHPV is a variant highest averages method of the party-list system and employs divisors in the geometric sequence 1, 2, 4, 8 and so on. These divisors are equivalent to the multipliers 1, 1/2, 1/4, 1/8 and so on that constitute the consecutively halved preference weightings for CHPV. Successively dividing by two is the same as successively multiplying by one half.
For the CHPV (or any other GV variant) maps, party stick diagrams using a logarithmic scale (of base R = 1/r) are used to identify all the two-way and three-way critical ties that determine the seat share domain boundaries on any map. Unfortunately, for the non-geometric sequences of D'Hondt or Sainte-Laguë divisors, a linear scale is more meaningful for use in party stick diagrams. In comparison to previous logarithmic examples, the following CHPV examples use a linear scale.
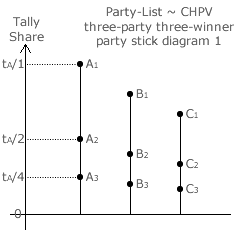
Party A obtains a tally share of tA in a three-party three-winner CHPV election. Hence, candidates A1, A2 and A3 have 'averages' of tA/1, tA/2 and tA/4 respectively. The averages for the other candidates are similarly determined by multiplying the share of the vote for their party by 1, 1/2 and 1/4 for the first-, second- and third-ranked candidates respectively on the party list.
The three resultant party sticks are shown in the party stick diagram opposite. The relative position of the dots on each linear party stick (with respect to the zero origin) hence correspond to the fractional 1, 1/2 and 1/4 share averages for the party-list candidates. Having the three highest averages, A1, B1 and C1 are clearly the winners here.
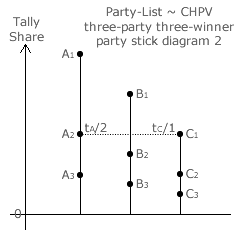
In a second run of the above example election, each of the three parties receives a different share of the vote. In particular, party C has a tally share half that of party A (tC = tA/2). This means that candidate A2 (with a tA/2 average) now critically ties with candidate C1 (with a tC/1 average) for the third and last available seat; see the party stick diagram opposite.
Notice that the height of a linear party stick varies in direct proportion to the tally share for that party. In contrast, a logarithmic one is fixed in height and only its vertical position varies with tally share.
Deducing the conditions for critical ties is therefore more difficult with linear party sticks but they are still very useful in determining the two-way and three-way critical ties for an election and the resultant seat share domain boundaries on the appropriate map. In the relevant later sections, the maps for the D'Hondt and Sainte-Laguë highest averages method are constructed using such linear party stick diagrams.
Proceed to next page > Comparisons: Party-List 3
Return to previous page > Comparisons: Party-List 1