
Comparisons: D'Hondt ~ Maps 2
Three-Party D'Hondt Party-List Maps
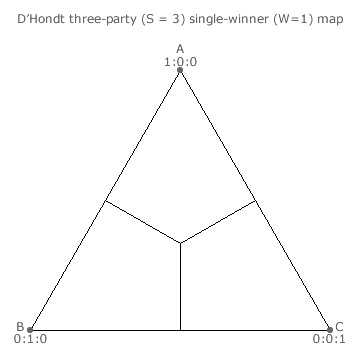
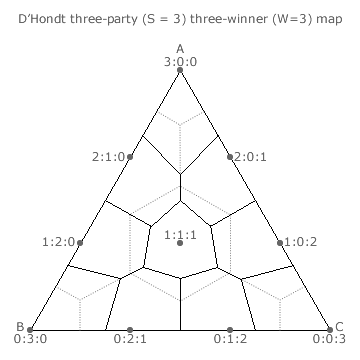
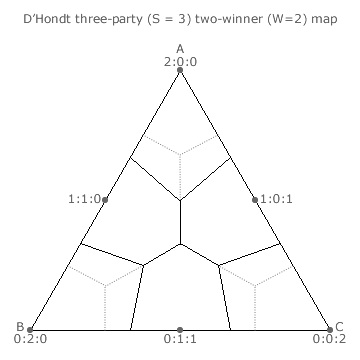
Three-party maps contain all the possible election outcomes for a given number of winners in a three-party election. The maps for three parties A, B and C contesting up to three vacancies in closed D'Hondt Party-List elections are shown on this page and those for four to six vacancies are shown on the next one. Recall that the actual per-unit tally shares for A, B and C are represented by the appropriate point on the triangular map where each share is measured at right-angles from the base (or map edge) towards its opposing apex.
The domain boundaries of an optimally proportional voting (OPV) system are hexagonal (or part thereof) and are indicated by the dotted lines on the map. Any point within an OPV domain is closer to the dot in the centre of that domain than to one in any another domain. The stated seat share ratio for the domain is therefore the optimal outcome for any such point (tally share ratio) within that domain.
The boundaries for the D'Hondt method domains are derived from the numerous two-way and three-way critical ties that may occur in elections with W winners. For the specific details of how party stick diagrams are used to deduce the position of these boundaries, please refer to the Map Construction appendix for the Three-Party D'Hondt Method Maps page.
For all points on a map that are in the same D'Hondt and OPV domains the outcome is optimally proportional. For all points in dissimilar domains the outcome is not optimal.
Proceed to next page > Comparisons: D'Hondt ~ Maps 3
Return to previous page > Comparisons: D'Hondt ~ Maps 1