
Map Construction: Three-Party D'Hondt Method Maps
Three-party (S = 3) two-winner (W = 2) scenario: Three parties A, B and C field two candidates each in a D'Hondt Method election to fill two vacant seats. Let the proportion of voters V preferring A be x, those preferring B be y and those preferring C be z; where x + y + z = 1. For each party, its candidates are ranked from 1 to W on its closed list; where here W = 2. Candidates are identified below by their party and rank position. The standard election profile notation and formats are used below to state the tally and tally share for each party.
- TA = xV and tA = x for the election profile x: A1,A2.
- TB = yV and tB = y for the election profile y: B1,B2.
- TC = zV and tC = z for the election profile z: C1,C2.
Using a party list, each party tally is therefore directly proportional to the share of the vote achieved by that party. The tally share for party A (tA), for party B (tB) and for party C (tC) is hence x, y and z respectively. Linear party stick diagrams can now be drawn for particular values of x, y and z that specify critical or non-critical ties.
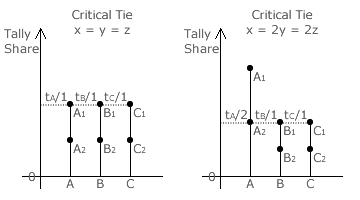
In order to draw the domain boundaries on a three-party map, all the three-way and two-way critical ties for the given number of winners must first be identified. One obvious three-way tie is when all the three parties have an equal tally share of x = y = z = 1/3; see opposite left. It is a critical tie as any two from three must be randomly selected.
Another critical three-way tie occurs when the second-ranked candidate of one party (A2) ties with the prime candidates of the other two (B1 and C1); see above right. The tally share ratio for A:B:C is 2:1:1 here as x = 2y = 2z. With one seat already won by A1, only one other now remains for the three tied candidates and random selection is again needed. There are two other cases of this critical tie; namely when B2 ties with A1 and C1 and when C2 ties with A1 and B1.
For this two-winner scenario, there are two types of two-way critical ties.
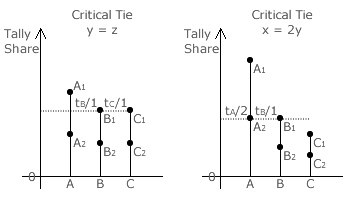
In the first type, one seat goes to the leading party (A1) and the second vacancy to one of the two other parties (B1 and C1) at random; see opposite left. There are three cases of this type; namely where A1, B1 and C1 gain the first seat outright and y = z, x = z and x = y respectively.
In the second type, the second seat goes instead to either the second-ranked candidate of the leading party (A2) or to the prime candidate of the second-ranked party (B1); see opposite right. Here x = 2y where z < y. There are six cases of this type given the number of permutations of A, B and C (since the factorial of 3 = 3! = 3 x 2 x 1 = 6).
For the two-winner (W = 2) map, both types of the three-way critical ties and both types of the two-way ones have now been identified. For more than two winners, there will be increasing numbers of tied-situation types but for W = 2 there are no further types. The four specific critical ties shown in the above party stick diagrams are drawn on the map below left. The three-way critical ties are shown as small dots. The central one is where the parties A:B:C have a tally share ratio of 1:1:1 and the one above is where they have a 2:1:1 ratio.
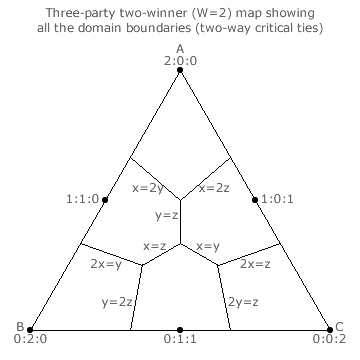
The two-way ties are shown as straight lines since the tally share of the non-tied party can vary from 0 to 1. Without exception, such two-way tie lines always extend from the relevant apex to the appropriate point on the opposing base. However, some stretches of a tie line are critical (and are shown as a full line) while others are not (and are shown as a dotted line). For the x = 2y tie line, values of z > 1/4 yield a non-critical tie between A2 and B1 whereas values of z < 1/4 result in a critical tie for the remaining vacancy. For the y = z tie line, the critical section is where 1/3 < x < 1/2. Only here must B1 or C1 be selected at random for the remaining seat.
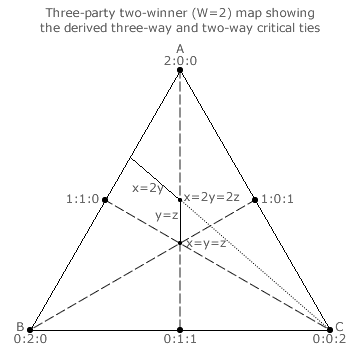
On the completed three-party two-winner map above right, all nine two-way critical tie lines are shown. These critical sections of the two-way tie lines hence form the unique seat share domain boundaries for this election. Each of the four three-way critical ties is at the junction where three two-way tie lines meet. Alternatively stated, each three-way critical tie is where three adjacent domains meet.
Each of the three dashed lines in the map above left bisects the triangle in half and each half is the mirror image of the other. Therefore, the six ranking regions that result from the three bisections are all symmetrical to each other. This hex-symmetry means that only the three-way and two-way critical ties in one of the six ranking regions must be identified; as shown. The others will be of exactly the same type (with just the relevant candidates transposed) and simply be reflections of this initial region. So, flip any base or rotate the map through one third of a cycle and the lines on the map will be identical.
Three-party (S = 3) three-winner (W = 3) scenario: Three parties A, B and C field three candidates each in a D'Hondt Method election to fill three vacant seats. Let the proportion of voters V preferring A be x, those preferring B be y and those preferring C be z; where x + y + z = 1. For each party, its candidates are ranked from 1 to W on its closed list; where here W = 3. Candidates are identified below by their party and rank position. The standard election profile notation and formats are used below to state the tally and tally share for each party.
- TA = xV and tA = x for the election profile x: A1,A2,A3.
- TB = yV and tB = y for the election profile y: B1,B2,B3.
- TC = zV and tC = z for the election profile z: C1,C2,C3.
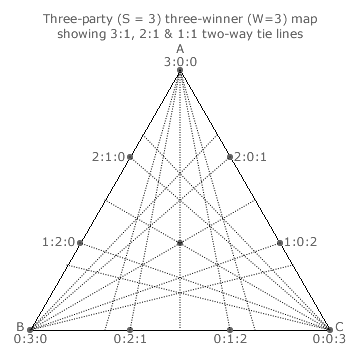
With an extra winner in this scenario, there will be additional critical ties to consider. However, by identifying the two-way ones first, the three-way ones will automatically appear as they result from the junction of three two-way ties. For two winners, the party stick diagrams indicated that the tally share ratios of 1:1 and 2:1 are key to the drawing of the two-way tie lines. For three winners, the D'Hondt divisors are now 1, 2 and 3 so the inclusion of the ratio of 3:1 here is equally important. For W = 3, all the fifteen two-way ties are shown as dotted lines on the map below left.
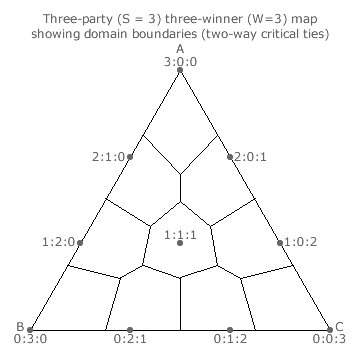
All that needs to be determined now is which sections of a two-way tie line are critical and which are not. This is done using party stick diagrams as described above. However, due to hex-symmetry, only one of the six ranking regions need be analysed as the other five are mere reflections of it. Once this analysis is complete and the critical two-way ties are known, these resultant domain boundaries can be redrawn as full lines and the non-critical sections deleted; as shown in the map above right.
Three-party (S = 3) multiple-winner (W = W) scenario: Three parties A, B and C field W candidates each in a D'Hondt Method election to fill W vacant seats. Let the proportion of voters V preferring A be x, those preferring B be y and those preferring C be z; where x + y + z = 1. For each party, its candidates are ranked from 1 to W on its closed list. Candidates are identified below by their party and rank position. The standard election profile notation and formats are used below to state the tally and tally share for each party.
- TA = xV and tA = x for the election profile x: A1,A2,~~~~,AW.
- TB = yV and tB = y for the election profile y: B1,B2,~~~~,BW.
- TC = zV and tC = z for the election profile z: C1,C2,~~~~,CW.
With more winners, there will be further two-way tie lines to draw on the map. In general, the tally share ratios 1:1, 2:1, 3:1 and so on up to W:1 are key and the corresponding two-way tie lines must be drawn. As always, party stick diagrams can then be employed to identify the critical and non-critical sections of these tie lines. Also, as always, only one of the hex-symmetrical regions need be analysed to derive the domain boundaries. The complete three-party map for any number of winners can therefore be produced quite easily using this standard approach.
Fully completed three-party maps for up to six winners are presented in the next section of the main text.
Return to main text > Comparisons: Party-List ~ D'Hondt Method
Refer to > Map Construction: Table of Contents