
Evaluations: Diagrams and Maps 5
Seat Shares and Domains
For multiple-winner party-list CHPV, its algorithm assumes a closed list for each party. Where a party wins X of the W seats, the top X candidates on its list fill these X seats. For the purpose of assessing party proportionality, it is assumed that W candidates stand for each party and that only parties nominate candidates.
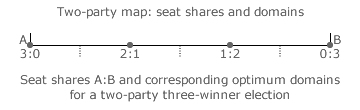
Party seat shares can also be mapped by in fact plotting the point for the party tally shares that correspond to an exactly proportional outcome between the tallies and seats. The two-party (S = 2) three-winner (W = 3) map opposite provides a suitable example. Each victor has one seat where each seat is one third of the total number of seats to be filled. The four dots on the map represent all the permutations of integer multiples of a one-third share for each party tally. Each dot hence represents one of the four possible seat share outcomes of a three-winner election.
For any given voter input, the distance between the actual tally shares (point) on the map and the resultant seat shares (dot) should be a minimum for optimal proportionality. The three dotted markers therefore indicate the optimum boundaries for the four different seat share domains. Each domain (range of points) has the same name as its seat share (dot); for example, 2:1.
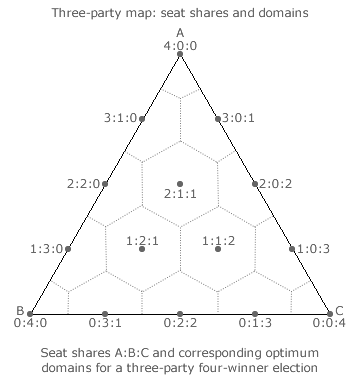
The example map opposite is for a three-party (S = 3) four-winner (W = 4) election. Here, each victor has one of the four available seats. The fifteen dots represent all the permutations of integer multiples of a one-quarter tally share for each party. These dots therefore represent the fifteen different possible election outcomes in terms of seats.
Again, for any given voter input, the distance between the actual tally shares (point) on the map and the resultant seat shares (dot) should be a minimum for optimal proportionality. The dotted lines shown on the map indicate the boundaries between adjacent seat share domains. All domains are either hexagons or truncated hexagons. Inside each domain, each point will be closest to the dot in the centre of its own hexagon than to any other dot on the map.
Each domain hence defines the optimum share of the seats that is common to all the tally share points within it. When a tally share point coincides with a domain boundary (dotted line), a critical tie between the two closest outcomes occurs. When a tally share point coincides with the corners of three adjacent domains, a critical tie between the three closest outcomes occurs. As always, critical ties must be resolved by random selection.
Each seat share domain consists of numerous rank order regions. However, within the interior of any domain, every boundary between adjacent regions only represents a non-critical tie between losing candidates. To avoid clutter, such non-critical ties inside domains are generally not shown as they are usually unimportant.
Construction of Multiple-Party Maps for CHPV
In terms of party tally shares (points) and party seat shares (dots), two-party and three-party maps for CHPV elections are developed as described above. However, the domain boundaries for CHPV are not co-incident with those for an optimally proportional voting (OPV) system. Indeed, it is the extent of the differences between any chosen system such as CHPV when compared to an OPV one that determines the proportion of optimally proportional results produced by that system.
In the following section, the featured two-party and three-party maps for CHPV are presented without any explanation of their domain construction. For those advanced visitors to this website who wish to understand how such maps are constructed or who wish to construct ones that are not featured for themselves, then please refer to the Map Construction appendix for either the Two-Party CHPV Maps or the Three-Party CHPV Maps page.
Proceed to next section > Evaluations: CHPV Maps
Return to previous page > Evaluations: Diagrams & Maps 4