
Mathematical Proofs: D'Hondt Method ~ Proportionality
Proof CDH1: Voting System Least Squares Index for D'Hondt Method
The centre of each domain has to be identified before the voting system least squares index can be calculated. Before dealing with the general case of S parties, the specific cases of two and three parties are addressed first.
Two-Party D'Hondt Method Map Example
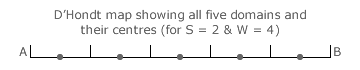
The map for an example two-party four-winner D'Hondt Method election is shown opposite. The domain boundaries are shown as vertical event markers and the domain centres as dots. Each domain boundary corresponds to a critical tie between the competing parties for the final vacant seat; the fourth seat here.
For party A to gain all four seats, its four tally share averages (tA/1, tA/2, tA/3 and tA/4) must all be higher than the highest one for party B (tB/1). One critical tie occurs when tA/4 = tB/1 and another when tA/3 = tB/2. By transposing the parties (to reflect the bi-symmetry of the map), the other two ties occur when tB/4 = tA/1 and when tB/3 = tA/2.
Notice that the sum of the two divisors used in each equation is 5 where this number is one more than the number of seats (W + 1). It is no co-incidence that there are W + 1 domains (five here) on a two-party map. For the D'Hondt Method, all domains have the same length of 1/(W + 1); or 1/5 here. Therefore, the centre of a two-party D'Hondt domain is simply its mid-point half-way along it.
Let YZ be the number of seats gained by party Z. For party Z, its per-unit tally share (tZ) at the centre of a domain is therefore (YZ + 1/2)/(W + 1). The centre is simply YZ whole domains and one half-domain from the relevant end of the map. By using the formula tZ = (YZ + 1/2)/(W + 1), the tally shares for the centre of every domain can be determined. The per-unit seat share (sZ) for party Z is simply YZ/W.
To calculate the LSI for each domain, the per-unit seat share (s) and tally share (t) for each party must be determined before the centre offset (t - s) can be calculated. Due to the reflective symmetry of pairs of domains on the map, mirror-image domains will have identical LSIs. For example, in this map, the two end domains and the two penultimate domains are both pairs of identical domains with common LSIs. Hence, only one domain LSI for each pair needs to be calculated. This LSI is then used twice for this type of domain in the overall LSI for the D'Hondt map.
Using all the above methods, the table below provides the individual domain type LSIs and the resultant overall one for a two-party four-winner D'Hondt Method election.
| Domain Seat Shares (s) | Domain Quantity | Centre Tally Shares (t) | Centre Offset (t-s) | Domain LSI | |||
|---|---|---|---|---|---|---|---|
| A | B | A | B | A | B | ||
| 4/4 | 0/4 | 2 | 9/10 | 1/10 | -1/10 | +1/10 | 1/10 |
| 3/4 | 1/4 | 2 | 7/10 | 3/10 | -1/20 | +1/20 | 1/20 |
| 2/4 | 2/4 | 1 | 5/10 | 5/10 | 0 | 0 | 0 |
| Total Quantity | 5 | LSIVS | 0.071 | ||||
Three-Party D'Hondt Method Map Example
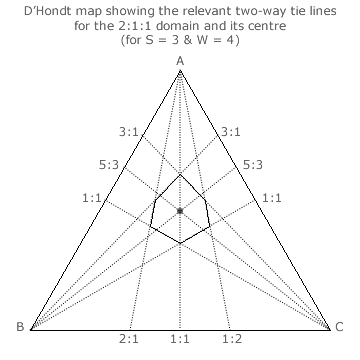
Consider a three-party four winner party-list D'Hondt Method election. The non-peripheral 2:1:1 seat share domain for this election is shown opposite. For a two-party domain, its centre is found by bisecting the domain. The same technique of bisection applies to three parties.
Three tie lines are shown intersecting at each apex. For each apex, the critical sections of the outer pair form two opposing sides of the irregular hexagon. The inner tie line exactly bisects the angle between the outer two lines in each case. These three inner tie lines inherently intersect at the same point; namely, at the centre of the domain.
The baseline opposing each apex is a two-party map and the relevant inner tie line bisects it mid-way between the two ends of a two-party domain. This is the necessary condition for a consistent definition of the location of domain centres regardless of the actual number of parties competing in an election.
For the 2:1:1 domain shown, the A:B = 5:3, the A:C = 5:3 and the B:C = 1:1 ties define its centre. The tally share ratio for the centre is hence 5:3:3 and the per-unit tally shares for parties A, B and C are therefore 5/11, 3/11 and 3/11.
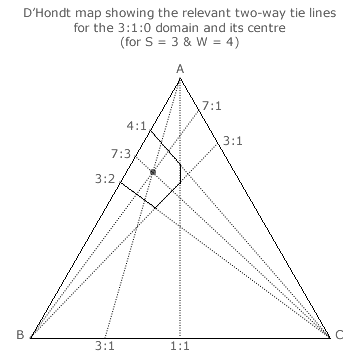
For peripheral domains, the same bisecting inner tie lines are drawn to establish the location of their centres. The only difference is that one of the pair of outer lines will be the map edge when it aligns with the relevant domain side. As an example, consider the peripheral 3:1:0 domain shown opposite.
For this 3:1:0 seat share domain, its centre is defined by the A:B = 7:3, the A:C = 7:1 and the B:C = 3:1 ties. The tally share ratio for the centre is hence 7:3:1 and the per-unit tally shares for parties A, B and C are therefore 7/11, 3/11 and 1/11.
For the mid-edge 2:2:0 domain (not shown), the A:B = 9:1, the A:C = 9:1 and the B:C = 1:1 ties define its centre. The tally share ratio for the centre is hence 9:1:1 and the per-unit tally shares for parties A, B and C are therefore 9/11, 1/11 and 1/11. Finally, for the apex 4:0:0 domain (not shown), the A:B = 1:1, the A:C = 5:1 and the B:C = 5:1 ties define its centre. The tally share ratio for the centre is hence 5:5:1 and the per-unit tally shares for parties A, B and C are therefore 5/11, 5/11 and 1/11.
These are the only four different types of domain on this map. Due to the hex-symmetry of the map, other domains of the same type are easily found by transposing two of the parties. By systematically working through all the permutations of seat shares, all the unique domains can be identified.
Notice that the three integers in the tally share ratio for any domain always sum to 11 and that consequently the divisor for the per-unit tally shares is always 11. The reason for this consistency is easier to understand if each tally share numerator and denominator is halved; thereby maintaining the same fractional ratio.
For example, the tally share numerators for the centre of the 3:1:0 domain are 3.5, 1.5 and 0.5 for parties A, B and C. Note that each party has a tally share numerator that is 0.5 greater than the number of seats it gained. So, where party Z wins YZ seats, its tally share numerator is YZ + 1/2. Recall that this very same expression featured in the numerator for the location of domain centres on two-party maps.
This relationship also holds true for the other three domain types for this map. For example, the tally share numerators for the centre of the 2:1:1 domain are 2.5, 1.5 and 1.5 for parties A, B and C. Indeed, this relationship holds true for all domains on all three-party maps. Generally then, for the YA:YB:YC seat share domain, its fractional tally share numerators are simply YA + 1/2, YB + 1/2 and YC + 1/2.
In order to achieve per-unit tally share values, the tally share denominator is simply the sum of the three numerators. Hence, this sum is YA + YB + YC + 3(1/2). As the sum of the seats won by the three parties totals to the number of seats to be won, then the tally share denominator is simply W + 3/2. Given that party Z has YZ out of W seats, its seat share (sZ) is YZ/W. Also, its tally share (tZ) at the centre of that domain is (YZ + 1/2)/(W + 3/2). Therefore, without the aid of any map, the central tally shares for any three-party domain can be derived using the formula tZ = (YZ + 1/2)/(W + 3/2).
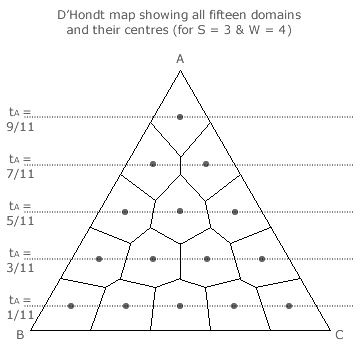
By using these techniques, the centre of every domain can be identified and the corresponding tally shares determined. The three-party four-winner map opposite presents all its domains and their centres. Notice, that for each horizontal row of domains shown, party A gains a common number of seats and that its central tally share is therefore also common to all the domains in the row.
To calculate the LSI for each domain, the seat share and the tally share for each party must be expressed as a per-unit value. For the apex domain, its seat share ratio is 4:0:0 for A:B:C. The per-unit seat shares (s) are respectively, 4/4, 0/4 and 0/4. The tally share ratio of the domain centre point is 9:1:1 for A:B:C yielding 9/11, 1/11 and 1/11 for the respective per-unit tally shares (t).
Now the centre offset (t - s) can be calculated for each party. Here it is -2/11 for A and +1/11 for both B and C. The LSI for this domain centre is the square root of half of the sum of these offsets squared. For this apex domain, its LSI is √3/11 or 0.157.
Due to the reflective symmetries of many of the domains on the triangular map, mirror-image domains will have identical LSIs. For example, in this map, the three apex domains, the three non-peripheral domains, the three mid-edge domains and the six remaining domains are all sets of identical domains with common LSIs.
Hence, only one domain LSI for each of the four domain types needs to be calculated. This LSI is then used as many times as there are domains of its type in the overall LSI for the D'Hondt Method map. Using all the above methods, the table below provides the individual domain type LSIs and the resultant overall one for a three-party four-winner D'Hondt Method election.
| Domain Seat Shares (s) | Domain Quantity | Centre Tally Shares (t) | Centre Offset (t-s) | Domain LSI | ||||||
|---|---|---|---|---|---|---|---|---|---|---|
| A | B | C | A | B | C | A | B | C | ||
| 4/4 | 0/4 | 0/4 | 3 | 9/11 | 1/11 | 1/11 | -2/11 | +1/11 | +1/11 | √3/11 |
| 3/4 | 1/4 | 0/4 | 6 | 7/11 | 3/11 | 1/11 | -5/44 | +1/44 | +4/44 | √21/44 |
| 2/4 | 2/4 | 0/4 | 3 | 5/11 | 5/11 | 1/11 | -1/22 | -1/22 | +2/22 | √3/22 |
| 2/4 | 1/4 | 1/4 | 3 | 5/11 | 3/11 | 3/11 | -2/44 | +1/44 | +1/44 | √3/44 |
| Total Quantity | 15 | LSIVS | 0.104 | |||||||
Multiple-Party D'Hondt Method Tabular Example
From the two previous map examples, it is clear that domain centres are represented by points where the relevant bisecting two-way tie lines all intersect. The same is true for any multiple-party election even though maps cannot be drawn for more than four parties. However, the domains and their centres can still be found using a general formula with the tabular approach. Each domain type and the quantity of each type can be derived by systematically working through all the permutations of possible seat share ratios.
In order to derive the multiple-party formula for tally share as a function of seat share, consider the general case of four-winner elections. Also, consider the specific case of the extreme seat share ratio domain where one party wins all the seats and the remaining (S - 1) parties gain none. As shown above, the central tally share ratio for two parties A:B is 9:1 for the 4:0 seat share domain and for three parties A:B:C it is 9:1:1 for the 4:0:0 one.
The addition of one extra party (C) to the four-winner election has not altered the ratio between A and B. Also, party C has the same seat share of zero as party B. Their domain centre tally shares are also equal. This is only to be expected since transposing parties does not change the domain type but simply identifies a different domain within this type. For example, the 4:0:0, 0:4:0 and 0:0:4 domains are the three cases of the apex type domain on a three-party map.
Therefore, adding a fourth party D to the four-winner election does not alter the inter-relationships between the existing three parties. Hence, for the 4:0:0:0 extreme seat share ratio domain, its central tally share ratio for A:B:C:D is 9:1:1:1. For an extra fifth party E, the 4:0:0:0:0 domain has its centre at a tally share ratio of 9:1:1:1:1 and so on for further parties.
As performed above, converting the tally share ratio into per-unit tally shares is best understood by first dividing all the integers in the ratio by two and then dividing each one by the sum of these halved integers. For example, the four-party 4:0:0:0 seat share domain has central tally shares of 4.5/6, 0.5/6, 0.5/6 and 0.5/6 for parties A, B, C and D. Note once more that the tally share numerator is still YZ + 0.5. Fortunately, this remains true for all the domains on a map irrespective of the number of parties (S) or the number of winners (W) in a D'Hondt Method election.
The tally share denominator for four parties is YA + 0.5 + YB + 0.5 + YC + 0.5 + YD + 0.5 or simply W + 4(1/2). For three parties, it is W + 3(1/2) and, for two parties, it is W + 2(1/2). Every time an extra party is included, an extra 0.5 is also added to the denominator. Hence, for S parties, the denominator is W + S/2. Therefore, for party Z with YZ seats, its per-unit tally share tZ at the centre of the relevant domain is given by the following formula.
- tZ = (YZ + 1/2)/(W + S/2)
Note that for perfect proportionality, tZ = YZ/W = sZ as tZ - sZ = 0.
By using the formula to derive tally shares from seat shares, there is in fact no need to draw any multi-dimensional maps. Having established the seat shares and tally shares for each domain type and entered them into a table, the various domain LSIs and the overall system LSI can then be calculated. As an example, the table for a four-party four-winner CHPV election is given below
| Domain Seat Shares (s) | Domain Quant. | Centre Tally Shares (t) | Centre Offset (t-s) | Domain LSI | |||||||||
|---|---|---|---|---|---|---|---|---|---|---|---|---|---|
| A | B | C | D | A | B | C | D | A | B | C | D | ||
| 4/4 | 0/4 | 0/4 | 0/4 | 4 | 9/12 | 1/12 | 1/12 | 1/12 | -3/12 | +1/12 | +1/12 | +1/12 | √6/12 |
| 3/4 | 1/4 | 0/4 | 0/4 | 12 | 7/12 | 3/12 | 1/12 | 1/12 | -2/12 | 0 | +1/12 | +1/12 | √3/12 |
| 2/4 | 2/4 | 0/4 | 0/4 | 6 | 5/12 | 5/12 | 1/12 | 1/12 | -1/12 | -1/12 | +1/12 | +1/12 | √2/12 |
| 2/4 | 1/4 | 1/4 | 0/4 | 12 | 5/12 | 3/12 | 3/12 | 1/12 | -1/12 | 0 | 0 | +1/12 | 1/12 |
| 1/4 | 1/4 | 1/4 | 1/4 | 1 | 3/12 | 3/12 | 3/12 | 3/12 | 0 | 0 | 0 | 0 | 0 |
| Total Quantity | 35 | LSIVS | 0.129 | ||||||||||
Voting System LSIs for S-Party W-Winner D'Hondt Method Elections
By employing the methodology described above, the voting system LSI for D'Hondt Method elections with numerous parties and winners can be derived. The table below summarises these LSIs for up to six parties and up to eight winners.
| LSIVS | W | |||||||
|---|---|---|---|---|---|---|---|---|
| 2 | 3 | 4 | 5 | 6 | 7 | 8 | ||
| S | 2 | 0.136 | 0.093 | 0.071 | 0.057 | 0.048 | 0.041 | 0.036 |
| 3 | 0.196 | 0.136 | 0.104 | 0.084 | 0.071 | 0.061 | 0.053 | |
| 4 | 0.237 | 0.167 | 0.129 | 0.105 | 0.088 | 0.078 | 0.067 | |
| 5 | 0.268 | 0.192 | 0.149 | 0.122 | 0.103 | 0.089 | 0.078 | |
| 6 | 0.293 | 0.211 | 0.165 | 0.136 | 0.115 | 0.100 | 0.088 | |
The main text displays the above data in bar chart form.
Return to main text > Comparisons: D'Hondt Method ~ Proportionality 1
Refer to > Mathematical Proofs: Table of Contents