
Mathematical Proofs: Droop Quota ~ Proportionality
Proof CDQ1: Voting System Least Squares Index for Droop Quota
Three-Party Droop Quota Map Example
The centre of each domain has to be identified before the voting system least squares index can be calculated. Before dealing with the general case of S parties, the specific case of three parties is addressed here first.
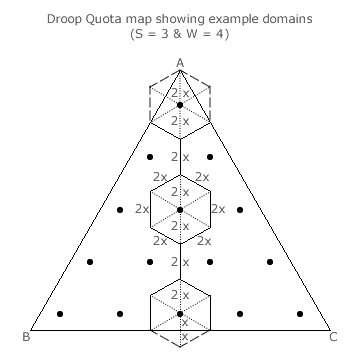
For this case, there are three types of domain; namely, inner domains, edge domains and apex domains. These hexagonal domains are respectively truncated by no edge, by one edge and by two edges. One example of each is shown in the map opposite.
For the Droop Quota, all the domains are regular hexagons of identical size. The domain boundaries are shown as full lines within the map and each of the six sides is of length 2x; see the example inner domain on the map. Where a hexagonal domain is truncated by one or two edges of the map, the truncated sides of the hexagon are shown as dashed lines; see the other two example domains on the map.
For each of the example domains shown opposite, the three non-critical two-way tie lines within those domains are drawn as dotted lines. These three diagonals between the opposing corners of each hexagonal domain naturally intersect at the centre of the domain where the relevant non-critical three-way tie occurs. Locating the centre of every domain is hence the same as identifying all such ties for a given number of parties (S) and seats (W).
The three two-way tie lines within each domain divide the hexagon into six equilateral triangles of identical size. Hence, the distance from the centre of a domain to any corner is equal to the hexagonal side length of 2x. For the example edge domain, the BC baseline bisects the downward vertical two-way tie from the domain centre to the truncated corner. Therefore, the distance from this bisection to the centre is x and from this bisection to the corner is also x.
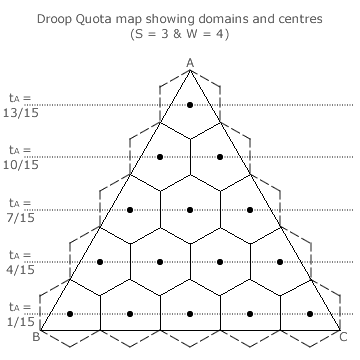
The distance from the baseline BC to the apex A is by definition equal to a 100% tally share for candidate A; namely tA = 1. From the example map above, it is also equal to seven lengths of 2x and one of x; so tA = 15x. Given that 15x = 1, then x = 1/15. The map opposite shows all the domains and their centres for this example election.
For the bottom row of centres, the tally share for candidate A is x or 1/15. For the row above, tA is 3x higher at 4/15. All adjacent rows are in fact separated by 3x or 3/15. For the apex domain (the only one in the top row), its centre is 2x or 2/15 below the apex A at tA = 13/15.
Due to the inherent tri-symmetry of the map, the domain centre tally shares for candidates B and C are also integer multiples of 3x above the initial offset of x.
By using this approach, the centre of every domain can be identified and the corresponding tally shares determined. To calculate the LSI for each domain, the seat share and the tally share for each party must be expressed as a per-unit value. For the apex A domain, its seat share ratio is 4:0:0 for A:B:C. The per-unit seat shares (s) are respectively, 4/4, 0/4 and 0/4. The tally shares (t) for the domain centre point are 13/15, 1/15 and 1/15. Now the centre offset (t-s) can be calculated for each party. Here it is -2/15 for A and +1/15 for both B and C. The LSI for this domain centre is the square root of half of the sum of these offsets squared. For this apex domain, its LSI is √3/15 or 0.115.
Due to the reflective symmetries of many of the domains on the triangular map, mirror-image domains will have identical LSIs. For example, in this map, the three apex domains, the three inner domains, the three mid-edge domains and the six remaining domains are all sets of identical domains with common LSIs. Hence, only one domain LSI for each of the four domain types needs to be calculated. This LSI is then used as many times as there are domains of its type in the overall LSI for the Droop Quota map. Using all the above methods, the table below provides the individual domain type LSIs and the resultant overall one for a three-party four-winner Droop Quota election.
| Domain Seat Shares (s) | Domain Quantity | Centre Tally Shares (t) | Centre Offset (t-s) | Domain LSI | ||||||
|---|---|---|---|---|---|---|---|---|---|---|
| A | B | C | A | B | C | A | B | C | ||
| 4/4 | 0/4 | 0/4 | 3 | 13/15 | 1/15 | 1/15 | -2/15 | +1/15 | +1/15 | √3/15 |
| 3/4 | 1/4 | 0/4 | 6 | 10/15 | 4/15 | 1/15 | -5/60 | +1/60 | +4/60 | √21/60 |
| 2/4 | 2/4 | 0/4 | 3 | 7/15 | 7/15 | 1/15 | -1/30 | -1/30 | +2/30 | √3/30 |
| 2/4 | 1/4 | 1/4 | 3 | 7/15 | 4/15 | 4/15 | -2/60 | +1/60 | +1/60 | √3/60 |
| Total Quantity | 15 | LSIVS | 0.076 | |||||||
Two-Party Droop Quota Map Example
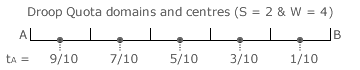
For two party contests, domains are now lengths along the unidimensional map. The example shown opposite is for a two-party four-winner Droop Quota election. With four seats, there are five domains of identical length as the quota is 1/(W+1) or 1/5. The domain boundaries (critical ties) are shown as full vertical markers and are spaced at intervals of 1/5. The intervening non-critical ties are shown as dashed markers and hence occur at odd multiples of 1/10.
In other words, the domain centre tally shares are integer multiples of 2x above an initial offset of x where x = 1/10 here. With no truncation, there are only 'inner' domains on two-party Droop Quota maps. However, with reflective symmetry about the centre, domains occur in pairs; with the exception of any central one. The LSI need only be determined for one domain of each pair or type and then used twice in the overall LSI. The table below provides the individual domain type LSIs and the resultant overall one for a two-party four-winner Droop Quota election.
| Domain Seat Shares (s) | Domain Quantity | Centre Tally Shares (t) | Centre Offset (t-s) | Domain LSI | |||
|---|---|---|---|---|---|---|---|
| A | B | A | B | A | B | ||
| 4/4 | 0/4 | 2 | 9/10 | 1/10 | -1/10 | +1/10 | 1/10 |
| 3/4 | 1/4 | 2 | 7/10 | 3/10 | -1/20 | +1/20 | 1/20 |
| 2/4 | 2/4 | 1 | 5/10 | 5/10 | 0 | 0 | 0 |
| Total Quantity | 5 | LSIVS | 0.071 | ||||
Multiple-Party Droop Quota Tabular Example
From the previous two map examples, it is clear that domain centres are represented by points where the tie is between all the parties and where that tie is non-critical. The same is true for any multiple-party election even though maps cannot be drawn for more than four parties. However, the domains and their centres can still be found using a tabular approach instead. Each domain type and the quantity of each type can be derived by systematically working through all the permutations of possible seat share ratios.
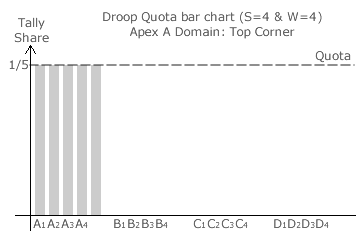
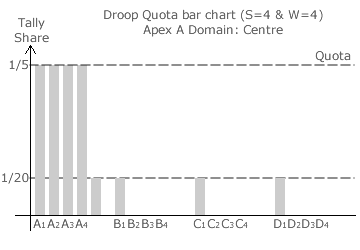
Droop Quota bar charts are particularly useful in highlighting the tally shares at the centre of a domain. Three such charts for an example Droop Quota election with four parties and four seats are shown opposite.
With four parties, the map is a solid tetrahedron. Consider the corner domain at apex A of this map where the seat ratio is 4:0:0:0 for parties A:B:C:D. The respective seat shares are hence 4/4, 0/4, 0/4 and 0/4.
At the top corner of the domain (apex A itself), party A has all of the votes cast and the others have none; see first bar chart. Each of the tallies for the four A candidates exceeds the quota of 1/(W + 1) or 1/5 with exactly 1/5 left over. Recall that the quota has to be exceeded and not merely equalled to win a seat so party A has only four seats.
The non-critical four-way tie and hence the domain centre occurs where this left-over 1/5 is shared equally by the four parties. The second bar chart shows this situation. The tally shares at the domain centre are therefore 1/20 each for parties B, C and D and 4/5 + 1/20 or 17/20 for party A.
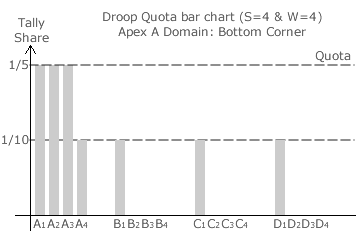
At the bottom corner of the domain (the one opposing apex A), there is necessarily a four-way critical tie; as shown in the third bar chart. Party A wins the first three seats with over 3/5 of the vote. The remaining 2/5 is now shared equally between the four parties. With each party having 1/4 of 2/5 or a 1/10 share of the tally, a random tie break is needed here to select one of the four.
The common tally share for parties B, C and D is 0 for the top corner and 1/10 for the bottom corner. As the domain centre is mid-way between these opposing corners, it is no surprise that the tally share here is also mid-way between 0 and 1/10; namely 1/20. Without drawing a map or indeed a single bar chart, this value of 1/20 is easily obtained. It is simply the quota share 1/(W + 1) divided by the number of parties (S).
The first row in the table below can now be completed. The shares of the seats (s) for the domain and the shares of the tallies (t) at its centre - as determined above - are simply entered into the appropriate cells along with the centre offsets (t-s differences). The domain quantity is four for this apex domain type as there are four unique permutations of the seats for each parties; namely, 4:0:0:0, 0:4:0:0, 0:0:4:0 and 0:0:0:4.
The same techniques can then be used to determine the data for each of the other domain types in the map. The next domain type has a quantity of twelve given the number of permutations of uniquely ordering 3, 1, 0 and 0 seats. The domain types should preferably be listed systematically from high to low seat share for party A then B and so on to ensure that all types are included. A seat share for a party (say B) should not exceed the one for the proceeding party (A) as it would simply be a permutation of an existing domain type. The completed LSI table is shown below.
| Domain Seat Shares (s) | Domain Quant. | Centre Tally Shares (t) | Centre Offset (t-s) | Domain LSI | |||||||||
|---|---|---|---|---|---|---|---|---|---|---|---|---|---|
| A | B | C | D | A | B | C | D | A | B | C | D | ||
| 4/4 | 0/4 | 0/4 | 0/4 | 4 | 17/20 | 1/20 | 1/20 | 1/20 | -3/20 | +1/20 | +1/20 | +1/20 | √6/20 |
| 3/4 | 1/4 | 0/4 | 0/4 | 12 | 13/20 | 5/20 | 1/20 | 1/20 | -1/10 | 0 | +1/20 | +1/20 | √3/20 |
| 2/4 | 2/4 | 0/4 | 0/4 | 6 | 9/20 | 9/20 | 1/20 | 1/20 | -1/20 | -1/20 | +1/20 | +1/20 | √2/20 |
| 2/4 | 1/4 | 1/4 | 0/4 | 12 | 9/20 | 5/20 | 5/20 | 1/20 | -1/20 | 0 | 0 | +1/20 | 1/20 |
| 1/4 | 1/4 | 1/4 | 1/4 | 1 | 1/4 | 1/4 | 1/4 | 1/4 | 0 | 0 | 0 | 0 | 0 |
| Total Quantity | 35 | LSIVS | 0.077 | ||||||||||
Voting System LSIs for S-Party W-Winner Droop Quota Elections
The domain centres occur at the same locations as the non-critical S-way ties. The left-over tally of 1/(W + 1) is equal to one remaining quota and is hence shared by these S parties so each has a remainder tally share of 1/[S(W + 1)] in addition to any full quotas and seats already accumulated. The length x in the two- and three-party elections above is in fact equal to this remainder tally share of 1/[S(W + 1)]. For the above four-winner elections, x = 1/10, 1/15 and 1/20 for S = 2, 3 and 4 respectively.
The domain centre tally share for a party with no seats is simply x. For the two- and three-party example election maps above, adjacent centres are spaced at intervals of 2x and 3x apart respectively. For the four-party example election table, this spacing is at intervals of 4x apart. For S parties, the interval spacing is simply Sx. Where a party gains just one seat, its domain centre tally share is Sx higher than x. Where a party wins Y out of the W vacant seats, its tally share becomes SxY higher than x or (SY + 1)x. As (SY + 1)x = S(Y + 1/S)x where x = 1/[S(W + 1)], the tally share for party Z at any particular Droop Quota domain centre can hence be obtained using the following formula.
- tZ = (YZ + 1/S)/(W + 1)
Note that for perfect proportionality, tZ = YZ/W = sZ as tZ - sZ = 0.
By using the formula to derive tally shares from seat shares, there is in fact no need to draw any bar charts let alone any multi-dimensional maps. The voting system LSI for Droop Quota elections with numerous parties and winners can hence easily be derived. The table below summarises these LSIs for up to six parties and up to eight winners.
| LSIVS | W | |||||||
|---|---|---|---|---|---|---|---|---|
| 2 | 3 | 4 | 5 | 6 | 7 | 8 | ||
| S | 2 | 0.136 | 0.093 | 0.071 | 0.057 | 0.048 | 0.041 | 0.036 |
| 3 | 0.152 | 0.102 | 0.076 | 0.061 | 0.051 | 0.043 | 0.038 | |
| 4 | 0.158 | 0.105 | 0.077 | 0.061 | 0.051 | 0.043 | 0.037 | |
| 5 | 0.161 | 0.105 | 0.077 | 0.061 | 0.050 | 0.042 | 0.037 | |
| 6 | 0.163 | 0.106 | 0.077 | 0.060 | 0.049 | 0.042 | 0.036 | |
The main text displays the above data in bar chart form.
Return to main text > Comparisons: Droop Quota ~ Proportionality 1
Refer to > Mathematical Proofs: Table of Contents