
Mathematical Proofs: Proportionality of CHPV
Proof EP1: Worst Case Seat Resolution Least Squares Index for OPV
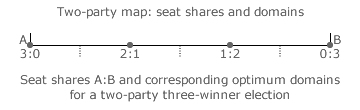
For optimally proportional voting (OPV), any resultant tally share ratio for the parties in that election should be rounded to the nearest seat share ratio in order to minimise the discrepancies. On the example two-party OPV map opposite, any tally share ratio (point along the line) should be rounded to the closest seat share ratio (dot). Hence, the two-party OPV domains are centred on the dots and have boundaries that are mid-way between successive dots. The worst case discrepancy clearly occurs when the tally share coincides with a domain boundary. Whichever boundary is relevant, the worst case discrepancy equates to half of the fixed domain length.
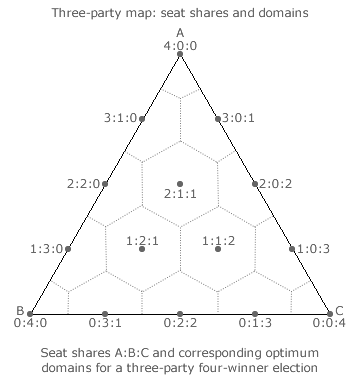
For the example three-party OPV map opposite, any tally share ratio (point within the triangular map) should be rounded to the nearest seat share ratio (dot). Hence, for the three-party OPV map, the domains are regular hexagons centred on the dots. The peripheral domains are however truncated hexagons due to the map edges. The worst case discrepancy between tally share and seat share occurs when the tally share point coincides with the point where three domains meet. As this applies to all 'triple-corner' points on the map, any one may be used to evaluate this worst case discrepancy.
Employing these two examples, now consider the general case of an S-party W-winner OPV election. The worst case discrepancy between tally share and seat share will occur when the tally share point coincides with the meeting of S domain boundaries. It does not matter which 'multiple-corner' point is selected for evaluation as they all yield the same worst case discrepancy. For convenience then, consider the extreme seat share scenario where one party A has all but one of the seats and every single party is tied (the 'multiple-corner' point) for the last remaining seat. The discrepancy is the same whoever wins so let party A achieve a clean sweep of all seats following the random tie break.
Except for party A, all the other parties have a per-unit tally share of 1/SW as this is the critical threshold above which any party would win the last seat outright. Each seat equates to a tally share or quota of 1/W but this is shared equally between the S parties. As the per-unit tally shares total to unity, party A therefore has a tally share of 1 minus the total awarded to the other parties. There are S-1 other parties and each one has a tally share of 1/SW.
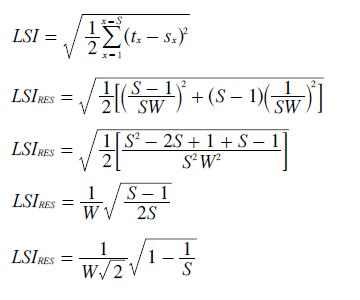
The Least Squares Index (LSI) is used to calculate the worst case discrepancy between tally shares (t) and seat shares (s). This LSI is stated opposite and evaluated using the tally shares derived above. The resultant LSIRES ranges from 0 to 1 and defines the worst case extent of party disproportionality between voter input and election outcome for any given resolution of available seats (W) and competing parties (S) in an optimally proportional voting system.
Return to main text > Evaluations: Proportionality 1
Refer to > Mathematical Proofs: Table of Contents