
Evaluations: Diagrams and Maps 2
Stick Diagrams (continued)
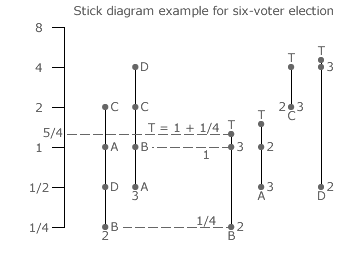
'Candidate sticks' can now be derived from ballot and block sticks to display the candidate performances. In the example opposite, block sticks 2 and 3 (from the previous example) define the voter input to a six-voter election. The resultant four candidate sticks are shown to the right of the two block sticks; with the name of each candidate underneath.
To produce the candidate B stick for example, each B dot on a block stick is projected horizontally so as to create this new vertical alignment. The dots on the B stick are relabeled to reflect the block stick from which they were obtained. The tally (T) for each candidate is simply the sum of all the dot values as each dot already represents a weighted preference total.
Each candidate stick may be extended upwards to indicate its tally value. [Mathematically, the B tally dot is placed at log2T against the scale where here log2(5/4) is 0.322 of one scale unit above the scale origin at 1; since log2(1) = 0.] From the descending order of the tally values, candidates D, C, A and B are ranked here from first to fourth place respectively. For an election with W seats (where W ≥ 1), the top-ranked W candidates are the winners.
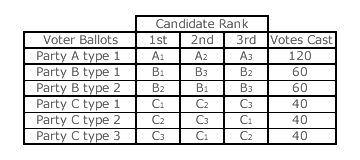
Candidate stick diagrams are useful in displaying the candidate tallies when there are no parties; just individuals. That is, in ranked ballot elections. Before introducing party stick diagrams, consider an illustrative three-winner (W = 3) ranked ballot CHPV election (using weightings of 1, 1/2, 1/4 and so on) with 360 voters; see table opposite. There are nine candidates as each of the three parties (A, B and C) fields three candidates. Each party is supported by exactly one third of the voters and all voters truncate their preferences after ranking just the three candidates of their chosen party.
All party A voters rank candidate A1 first, A2 second and A3 third. Half of party B supporters all rank B1 ahead of B3 with B2 last (type 1 ballot) while the other half consistently prefer an alternative ranking (type 2 ballot); see above table. Further, party C voters award one third of their first, second and third preferences to each party candidate.
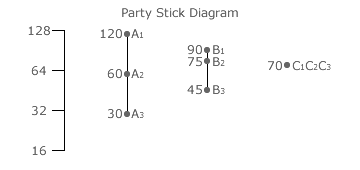
The party stick diagram for this example election is shown opposite. A party stick only displays the one tally (T) dot for each of its own candidates. For clarity, it dispenses with all the individual weighted preference totals that contribute to this overall candidate tally. Such detail is not needed and is simply clutter. Hence, party stick A connects the tally (120 x 1) for A1 via the tally (120 x 1/2) for A2 to the tally (120 x 1/4) for A3. The dots on the party sticks for B and C are similarly derived. The party stick for C has no height as all its three candidates have the same tally of (40 x 1) + (40 x 1/2) + (40 x 1/4) or 70.
As there are three seats to be filled and as each party has one third of the vote, then the truly proportional result would be where each party wins one seat. Despite this three-way party tie, party A actually wins one seat, B wins two and C wins none as A1, B1 and B2 are the three top-ranked winning candidates. If the voters for each party had voted consistently for one party candidate first, another second and the remaining one third (as party A voters indeed did), each party would have gained one seat and the election outcome would then have been truly proportional.
The actual lack of party proportionality is clearly due to the differing preferences within each party for its three candidates. If voters are completely free to rank the candidates within their chosen party (as the ranked ballot CHPV algorithm allows them to), then mayhem rather than proportionality appears to result. The question of whether party supporters or the parties themselves should rank the candidates now needs to be addressed in more detail.
Proceed to next page > Evaluations: Diagrams & Maps 3
Return to previous page > Evaluations: Diagrams & Maps 1