
Evaluations: Proportionality of CHPV 3
Voting System Least Squares Index for CHPV
Once the domain centres are identified, the centre offset least squares index (LSIj) for each CHPV domain can then be calculated. Each party seat share and party tally share should be expressed as a per-unit value (one ranging between 0 and 1). Once calculated, the voting system least squares index (LSIVS) for CHPV can be determined for a given number of competing parties and vacant seats; see proof EP2. The bar chart below shows the LSIVS for a CHPV election with up to six parties (S) and up to eight winners (W). Remember that as a measure of disproportionality, any LSI should be as low as possible for maximum proportionality.
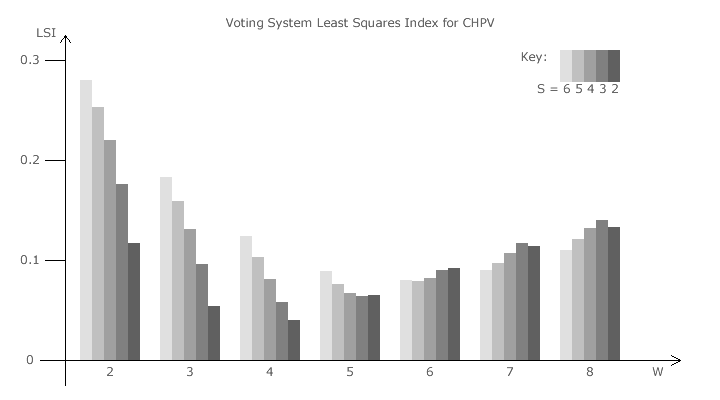
As the number of seats (W) increases, the LSIVS for party-list CHPV declines sharply towards its minimum value before rising more slowly thereafter. This relative trend is independent of the number of parties (S) contesting the election. However, the value of the minimum LSIVS and the optimum number of winners does vary slightly with the number of parties entering the contest.
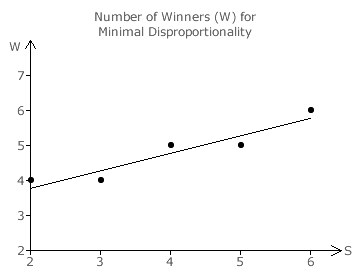
For two and three parties, the minimum LSIVS is achieved with four winners. For four or five parties, the optimum number of winners is five and, for six parties, it is six winners. These values are plotted on the graph opposite and a straight line approximation is drawn through these points.
Although the number of parties (S) and seats (W) are inherently discrete in nature, this line does indicate the essential relationship between these two variables. When just two parties nominate candidates, four seats is the optimal number. For every two additional parties expected to compete in a party-list CHPV election, one extra seat should be included to maintain minimal disproportionality.
Proceed to next page > Evaluations: Proportionality 4
Return to previous page > Evaluations: Proportionality 2