
Mathematical Proofs: Proportionality of CHPV
Proof EP2: Voting System Least Squares Index for CHPV
Three-Party CHPV Map Example
The centre of each domain has to be identified before the Voting System Least Squares Index can be calculated. Before dealing with the general case of S parties, the specific case of three parties is addressed here first. For this case, there are two types of domain; namely, peripheral and non-peripheral.
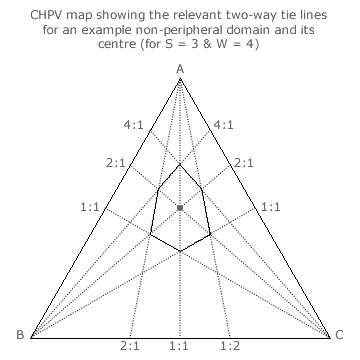
By definition, the non-peripheral hexagonal domains are not truncated by any edge. The peripheral domains truncated by one edge have five sides and those (apex ones) truncated by two edges have four sides. The map opposite shows an example of a non-peripheral domain.
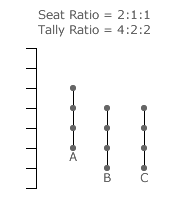
For non-peripheral domains, each pair of opposing sides of the irregular hexagon is defined by the relevant critical sections of a pair of two-way tie lines. Also, the relevant non-critical section of the intervening tie line forms a central diagonal across a domain. The centre of a domain is where its three diagonals cross and this intersection represents a non-critical three-way tie.
For the 2:1:1 seat share domain shown, the diagonals have a tally ratio of 2:1 for A:B, 2:1 for A:C and 1:1 for B:C. The tally share ratio at the domain centre is therefore 2:1:1 for A:B:C. In this specific example, the seat share ratio and the tally share ratio are identical. Generally, these ratios differ but the tally shares are always derived from the three intersecting two-way tie lines at a non-peripheral domain centre.
Consider another non-peripheral domain example with three parties and six winners. The relevant map is shown in the Evaluations: CHPV Maps section. Take the 3:2:1 seat share domain. It is a non-peripheral domain as no party has a seat share of zero. For the tally share ratio A:C, the intervening 4:1 tie line forms one of the diagonals. For A:B and B:C, the intervening tie lines each have a ratio of 2:1. Hence, the A:B:C tally share ratio at the domain centre is 4:2:1.
For the non-peripheral 4:1:1 seat share domain, it is centred at a tally share of 8:1:1. When the tally share ratio for every non-peripheral domain centre on every three-party map is derived, an obvious pattern emerges between this ratio and the seat share ratio for each domain. For a seat share ratio of x:1, the corresponding tally share ratio (y:1) is always just 2x-1:1. This formula of y = 2x-1 clearly checks out for the examples considered above. Although the workings for the remaining domains are not shown here, this formula still applies in each and every case.
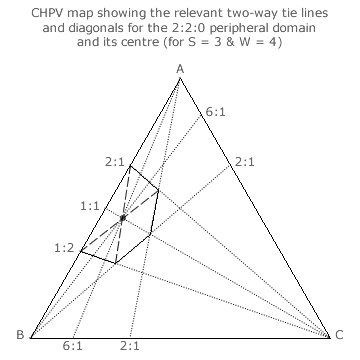
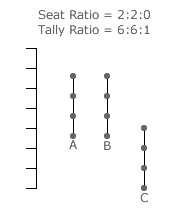
For a peripheral domain, it is still possible to draw three diagonals across it; see the 2:2:0 domain example opposite. As always, these three diagonals still intersect at the centre of the domain. Note that a peripheral domain is always truncated by at least one map edge and hence one party has a zero seat share (x = 0) along any such edge.
However, only one of the three diagonals is an intervening two-way tie line. In this example, it is the A:B = 1:1 tie line. As two sides of the irregular hexagon have been truncated by the AB map edge, there is only one pair of untruncated opposing sides to the domain. These are the A:B = 2:1 and A:B = 1:2 tie lines here.
The other two diagonals (shown as dashed lines) are simply drawn between the opposing but untruncated corners of the irregular hexagon. Neither of these two diagonals are two-way tie lines. The tally shares must therefore be determined from the geometry of the domain and the map. At the intersection, the tally shares are respectively 6/7, 6/7 and 1/7 for parties A, B and C. The tally share ratio is hence 6:6:1 for this 2:2:0 domain centre.
The tie lines for A:B = 6:1 and A:C = 6:1 are shown on the map and duly intersect at the domain centre. Using the formula y = 2x-1, the anticipated tally share ratio would be 2:2:0.5 for this 2:2:0 seat share domain. However, the actual tally share ratio is 6:6:1. Parties A and B have a tally share that is three times greater than expected when the tally share for party C is normalised at one.
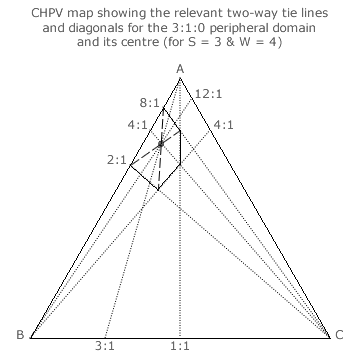
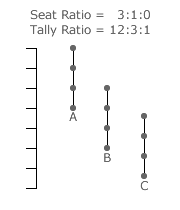
So consider another peripheral domain; the 3:1:0 domain as shown in the map opposite. Here, the A:B = 4:1 tie line forms a diagonal in between the 8:1 and 2:1 domain sides. The two other diagonals (shown as dashed lines) intersect this tie line at the centre of the domain as usual. From the geometry of the domain and the map, the tally shares are 12/16, 3/16 and 1/16 for parties A, B and C respectively. The tally share ratio for the domain centre is hence 12:3:1.
Using the formula y = 2x-1 again, the anticipated tally share ratio would be 4:1:0.5 for this 3:1:0 seat share domain. Comparing it to the actual tally share ratio of 12:3:1, parties A and B once more have a tally share that is three times greater than expected when the tally share for party C is normalised at one. When the tally share ratio for every peripheral domain centre on every three-party map is derived, the factor of three again appears each and every time.
Therefore, for a peripheral domain, the formula for deriving a tally share (y) from a non-zero seat share (x) is also simply stated. Namely, y = 3[2x-1] when a seat share of zero is normalised at a tally share of one (y = 1 for x = 0).
Notice that this factor of three is also visible in the above two maps. On each map, there are two tie lines intersecting at apex A and another two at apex B. In every case, one tie at each apex has a tally share ratio of y:1 while the other has one of 3y:1. For example, take the 3:1:0 domain in the above map. One side of this domain is aligned with the A:C = 4:1 tie line and its centre has a tally ratio of A:C = 12:1. Another side is aligned with the B:C = 1:1 tie line and its centre has a tally ratio of B:C = 3:1. This factor of three between side and centre tie lines applies to all peripheral domains but only in relation to those sides of the domain that have no opposing side due to domain truncation by the map edge.
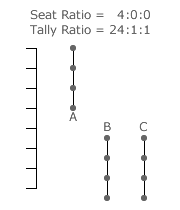
Now consider the 4:0:0 seat share domain as it is truncated by two edges. The sole intervening tie line is the B:C = 1:1 diagonal. It is not possible to draw the other two diagonals as there are no opposing domain corners from which to draw them. This domain is however a peripheral one and for consistency the non-peripheral formula ought to be employed to determine its central tally shares. This yields a tally share ratio of 24:1:1 as both party B and C have a seat share of zero.
This 24:1 tally share ratio for A:B and A:C should also be generated when considering the factor of three between side and centre tie lines. As each (non-map-edge) side has a tally share ratio of 8:1, then the domain centre should and does have one that is three times greater; namely, 24:1.
The peripheral 2:2:0, 3:1:0 and 4:0:0 seat share domains are all truncated by the AB map edge and are located consecutively along it. Notice that their central A:C tally ratios are respectively 6:1, 12:1 and 24:1. This consecutive doubling of the tally for A between adjacent peripheral domains is also witnessed for all the other multiple-winner three-party maps.
Although two of the three diagonals for a corner domain cannot be drawn, the above checks confirm that the peripheral formula does apply to all peripheral domains whether truncated by one or more map edges.
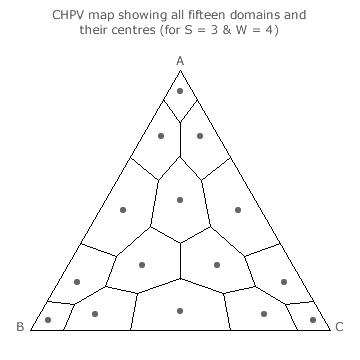
By using these techniques, the centre of every domain can be identified and the corresponding tally share ratio determined. The three-party four-winner map opposite presents all its domains and their centres. To calculate the LSI for each domain, the seat share and the tally share for each party must be expressed as a per-unit value.
For the corner domain, its seat share ratio is 4:0:0 for A:B:C. The per-unit seat shares (s) are respectively, 4/4, 0/4 and 0/4. The tally share ratio of the domain centre point is 24:1:1 for A:B:C yielding 24/26, 1/26 and 1/26 for the respective per-unit tally shares (t). The centre offset (t - s) can now be calculated for each party. Here it is -2/26 for A and +1/26 for both B and C. The LSI for this domain centre is the square root of half of the sum of these offsets squared. For this apex domain, its LSI is √3/26 or 0.067.
Due to the reflective symmetries of many of the domains on the triangular map, mirror-image domains will have identical LSIs. For example, in this map, the three corner domains, the three non-peripheral domains, the three mid-edge domains and the six remaining domains are all sets of identical domains with common LSIs.
Hence, only one domain LSI for each of the four domain types needs to be calculated. This LSI is then used as many times as there are domains of its type in the overall LSI for the CHPV map. Using all the above methods, the table below provides the individual domain type LSIs and the resultant overall one for a three-party four-winner CHPV election.
| Domain Seat Shares (s) | Domain Quantity | Centre Tally Shares (t) | Centre Offset (t - s) | Domain LSI | ||||||
|---|---|---|---|---|---|---|---|---|---|---|
| A | B | C | A | B | C | A | B | C | ||
| 4/4 | 0/4 | 0/4 | 3 | 24/26 | 1/26 | 1/26 | -2/26 | +1/26 | +1/26 | √3/26 |
| 3/4 | 1/4 | 0/4 | 6 | 12/16 | 3/16 | 1/16 | 0 | -1/16 | +1/16 | 1/16 |
| 2/4 | 2/4 | 0/4 | 3 | 6/13 | 6/13 | 1/13 | -1/26 | -1/26 | +2/26 | √3/26 |
| 2/4 | 1/4 | 1/4 | 3 | 4/8 | 2/8 | 2/8 | 0 | 0 | 0 | 0 |
| Total Quantity | 15 | LSIVS | 0.058 | |||||||
Two-Party CHPV Map Example
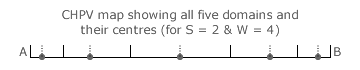
For two-party CHPV contests, domains are now lengths along the unidimensional map. The example shown opposite is for a two-party four-winner election. The domain boundaries (two-way critical ties) are shown as full vertical event markers and the intervening two-way non-critical ties as dashed vertical event markers.
With the same number of winners as the above three-party map example, this two-party one where party C does not exist necessarily corresponds directly with the three-party AB map edge where party C has no votes. However, while all the domains along the map edge are peripheral ones, only the end two are peripheral ones on the two-party map. Do the same formulae apply to two-party maps as they do to three-party ones?
For the two-party map, consider one of the three non-peripheral domains. The 3:1 seat share domain is bounded by the 8:1 and 2:1 critical ties. Using the non-peripheral formula y = 2x-1, its domain centre is at the intervening non-critical tie of 4:1. This is indeed the expected and required result as the A:B = 4:1 tie line on the three-party map is the central intervening diagonal for the 3:1:0 domain. The non-peripheral formula also checks out for all the other non-peripheral domains here on this particular two-party map and indeed on all the other multiple-winner ones.
Now consider the two peripheral domains. Using the peripheral formula y = 3[2x-1], the 4:0 and 0:4 seat share domains have their centres at a tally share ratio of 24:1 and 1:24 respectively. These are the same A:B ratios as for the two apex domains on the three-party AB map edge. The peripheral formula is found to apply consistently on all the other multiple-winner two-party maps too.
The table below provides the individual domain type and overall map LSIs for a two-party four-winner CHPV election.
| Domain Seat Shares (s) | Domain Quantity | Centre Tally Shares (t) | Centre Offset (t - s) | Domain LSI | |||
|---|---|---|---|---|---|---|---|
| A | B | A | B | A | B | ||
| 4/4 | 0/4 | 2 | 24/25 | 1/25 | -1/25 | +1/25 | 1/25 |
| 3/4 | 1/4 | 2 | 8/10 | 2/10 | +1/20 | -1/20 | 1/20 |
| 2/4 | 2/4 | 1 | 4/8 | 4/8 | 0 | 0 | 0 |
| Total Quantity | 5 | LSIVS | 0.040 | ||||
Multiple-Party CHPV Tabular Example
From the two previous examples, it is clear that domain centres can be found using the relevant peripheral or non-peripheral formula on both two- and three-party maps. Although it is not easy to visualise the solid domains of a tetrahedral four-party map, it is perhaps possible to see that the two formulae still apply here too. Recall that each face of the tetrahedron is a three-party map where one of the four parties has no votes. Also, remember that two-way ties on a four-party map are planes and that domain centres are hence where the relevant planes intersect at a point.
The same two formulae also apply to any multiple-party election even though maps cannot be drawn for more than four parties. However, without the aid of a map, every seat share domain for an election must still be identified. In fact, each domain type and the quantity of each type can easily be derived by systematically working through all the permutations of possible seat share ratios.
Returning to the three-party (S = 3) four-winner (W = 4) election example above, a party stick diagram is shown below for each of the four different types of domain. The seat share ratio identifies a domain and its corresponding tally share ratio identifies its centre. Differentiating between peripheral and non-peripheral domains is straightforward. If the seat share ratio contains at least one zero share (x = 0), then the domain is a peripheral one; otherwise it is non-peripheral. In these four scenarios, it is clear which four of the candidates win despite any ties between some of them. All ties between candidates at domain centres are inherently non-critical.
In this example, there are three domains of the 4:0:0 seat share ratio type as the ratios 0:4:0 and 0:0:4 also produce the same domain LSI as 4:0:0. The next domain type has a quantity of six given the number of permutations of ordering 3, 1 and 0; namely, 3:1:0, 3:0:1, 1:3:0, 1:0:3, 0:3:1 and 0:1:3. The remaining two domain types each have three different permutations of their ratio. These permutations cover all the fifteen domains for this election.
Having established the seat share and tally share for every domain type and the number of domains of each type, this data is entered into a table. The various domain LSIs and the overall voting system LSI can then be calculated. As an example, the table for a four-party four-winner CHPV election is given below. In particular, note the systematic listing of the domain seat shares to ensure that no domain type is omitted.
| Domain Seat Shares (s) | Domain Quant. | Centre Tally Shares (t) | Centre Offset (t - s) | Domain LSI | |||||||||
|---|---|---|---|---|---|---|---|---|---|---|---|---|---|
| A | B | C | D | A | B | C | D | A | B | C | D | ||
| 4/4 | 0/4 | 0/4 | 0/4 | 4 | 24/27 | 1/27 | 1/27 | 1/27 | -3/27 | +1/27 | +1/27 | +1/27 | √6/27 |
| 3/4 | 1/4 | 0/4 | 0/4 | 12 | 12/17 | 3/17 | 1/17 | 1/17 | -3/68 | -5/68 | +4/68 | +4/68 | √33/68 |
| 2/4 | 2/4 | 0/4 | 0/4 | 6 | 6/14 | 6/14 | 1/14 | 1/14 | -1/14 | -1/14 | +1/14 | +1/14 | √2/14 |
| 2/4 | 1/4 | 1/4 | 0/4 | 12 | 6/13 | 3/13 | 3/13 | 1/13 | -2/52 | -1/52 | -1/52 | +4/52 | √11/52 |
| 1/4 | 1/4 | 1/4 | 1/4 | 1 | 2/8 | 2/8 | 2/8 | 2/8 | 0 | 0 | 0 | 0 | 0 |
| Total Quantity | 35 | LSIVS | 0.081 | ||||||||||
Voting System LSIs for S-Party W-Winner CHPV Elections
By employing the methodology described above, the voting system LSI for party-list CHPV elections with various parties and winners can be derived. The table below summarises these LSIs for up to six parties and up to eight winners.
| LSIVS | W | |||||||
|---|---|---|---|---|---|---|---|---|
| 2 | 3 | 4 | 5 | 6 | 7 | 8 | ||
| S | 2 | 0.117 | 0.054 | 0.040 | 0.065 | 0.092 | 0.114 | 0.133 |
| 3 | 0.176 | 0.096 | 0.058 | 0.064 | 0.090 | 0.117 | 0.140 | |
| 4 | 0.220 | 0.131 | 0.081 | 0.067 | 0.082 | 0.107 | 0.132 | |
| 5 | 0.253 | 0.159 | 0.103 | 0.076 | 0.079 | 0.097 | 0.121 | |
| 6 | 0.280 | 0.183 | 0.124 | 0.089 | 0.080 | 0.090 | 0.110 | |
The main text displays the above data in bar chart form.
Return to main text > Evaluations: Proportionality 3
Refer to > Mathematical Proofs: Table of Contents