
Evaluations: Proportionality of CHPV 4
The Party Proportionality of Party-List CHPV
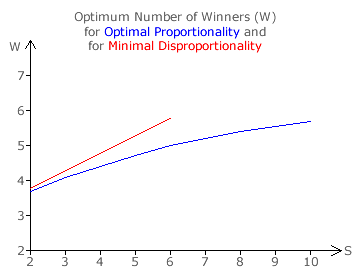
This proportionality section has focused on the voting system least squares index (LSIVS) as a measure for minimising disproportionality in terms of the number of competing parties (S) and the number of winnable seats (W). The previous Evaluations: Optimality section instead focused on the proportion of optimally proportional outcomes as another measure for ensuring party proportionality for elections with S parties and W seats. The relevant graph for each of these two parameters is repeated opposite to enable a direct comparison between them.
These two independent assessments of the optimum number of seats for a given number of competing parties measure two different aspects of party-list CHPV. A particular election may produce an optimally proportional outcome but, unless it is perfectly proportional, there will still be some disproportionality between tally shares and seat shares.
There is therefore no necessity for these two parameters to be in full agreement yet they do produce very similar results. Optimal proportionality and minimal disproportionality are both achieved where only a few candidates are to be declared the winners. This number varies slightly but it is around five seats.
In particular, both measures confirm that there is indeed an optimum number of winners. That is, they both reach a peak at a particular intermediate number of seats between two and infinity. This is a unique feature of party-list CHPV compared to other popular party-list systems. In these other systems, optimality progressively worsens and party proportionality steadily improves as the number of seats is increased; see next chapter. Given this inherent conflict between these two parameters, there is simply no optimum number here.
Hence, it is fair to state that in order to achieve a high level of optimality and party proportionality, party-list CHPV elections should be held with relatively few winners (W ≤ 6). Where a large number of winners are required, this election should be partitioned and conducted simultaneously across numerous constituencies with a few seats in each one.
All possible election outcomes influence optimality whereas only those limited number of cases where perfect party-proportionality is potentially possible are included in the LSIVS disproportionality index. For this index, only the one central offset sample for each domain contributes to it. Also, these samples on any multiple-party map are not uniformly distributed within it. Further, as additional seats are added to any such CHPV map, the resultant extra domains occur towards the map periphery and not near its centre. The more samples that are included in the index, the more these samples are unevenly distributed within the spectrum of all possible election outcomes.
It is instructive to compare the disproportionality index for CHPV to that of other voting systems (see next chapter) but it is just a benchmark index. It is better to use optimality as a guide for setting the number of seats available in any specific election. This remains the case even when optimality is estimated using the extreme seat share domain approximation model. Therefore, without knowing in advance the number of parties that will stand in each constituency but assuming that there will be more parties than seats, party proportionality within party-list CHPV is likely to be maximised with around five seats.
Fortunately, with this relatively low number of winners, attempts at gaining an unfair advantage through party cloning are unlikely to be successful; see preceding section. When party-list CHPV elections are held in few-winner constituencies, the combating of party cloning and the maximisation of both optimality and proportionality are essentially all operating in unison.
Proceed to next section > Evaluations: Summary (Party-List)
Return to previous page > Evaluations: Proportionality 3