
Mathematical Proofs: Geometric Voting
Proof CG4: Iso-Tally Grid Lines on Three-Candidate Maps
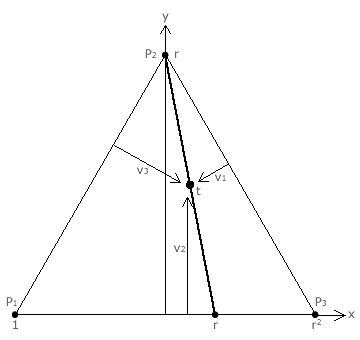
For each candidate in a three-candidate election that uses positional voting, their share of first, second and third preferences can be plotted on a three-candidate map; see opposite. Every candidate receives a preference of some weight from each voter as truncation is not permitted here.
Let the number of first preferences (P1) cast for a particular candidate be V1, the number of second preferences (P2) be V2 and the number of third preferences (P3) be V3. The sum of these numbers must hence equal the number of voters (V). Dividing V1, V2 and V3 by V yields the share of first, second and third preferences received by a candidate.
These per-unit shares (v1, v2 and v3) necessarily sum to unity and can hence be represented on an equilateral triangular map. Such a map is very similar in construction and use to the Three-Party CHPV Maps described in the Map Construction appendix. Here however, each apex represents a full share for the stated preference and no share for the other two. For example, apex P1 represents a candidate with a first preference from every voter.
As GV can represent any three-candidate positional voting system, then let GV with a common ratio of r be the method employed in the election.
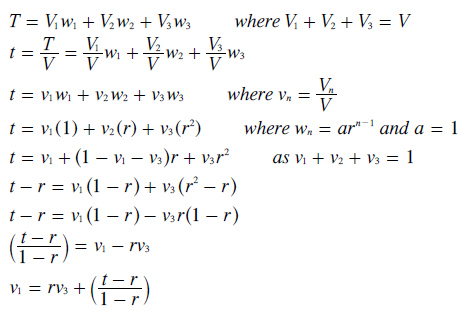
For convenience, let the first preference be worth one so that the second and third preferences are worth r and r2. As shown below, the tally (T) for a candidate is then simply the sum of the total number of each preference times its own weighting. Dividing T by V yields the average tally per voter (t) and it is this value that any point on the map represents. The division by V for each candidate tally does not alter the collective candidate rankings as the rank order of the T and t values are identical. The derivation that follows derives the relationship between the share of first and third preferences for a given value of r and t.
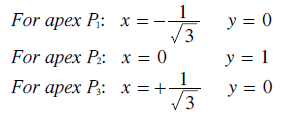
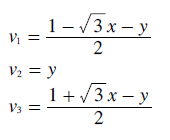
Grid lines where every point along such a line has the same value for the average tally per voter (t) are called iso-tally lines. To prove that such lines are parallel straight lines when plotted on the map it is convenient to use conventional cartesian co-ordinates (x,y) rather than the preference share co-ordinates (v1,v2,v3). The cartesian origin of the map is at the mid-point of the P1P3 baseline. Bearing in mind that the map is an equilateral triangle of unit perpendicular height, the x and y co-ordinates of each apex are defined below left. The straight line equation for each baseline is also given; below right.
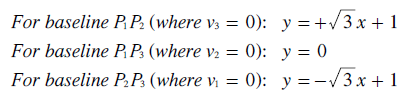
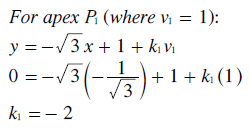
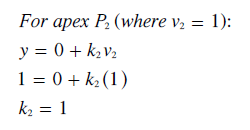
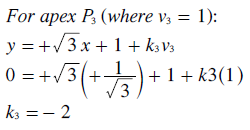
As each preference share varies from zero at its baseline to one at its apex, then the scaling constant k for each preference share can be determined as shown below.
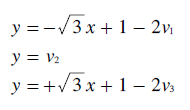
Substituting these three values for k back into their original equations yields the relationships between the x,y and v1,v2,v3 co-ordinates; see below. Clearly, as intended, the y and v2 co-ordinates are one and the same.
By rearranging these three equations, the transform equations for each of the three preference share co-ordinates in terms of x and y are derived; see below.
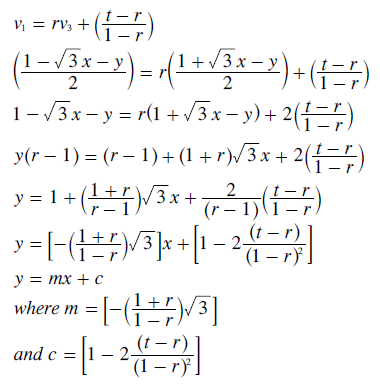
The above expressions for v1 and v3 can then be substituted into the equation (derived above) that defines the relationship between v1 and v3; see below. The derivation that follows demonstrates that y is indeed a straight line function of x.
The primary iso-tally grid line is defined as the one where the average tally per voter (t) is equal to the weighting of the second preference (r). This primary iso-tally line always intercepts the y-axis at apex P2 as c = 1 for t = r regardless of the specific value of r; see below. This is not surprising since apex P2 represents a candidate with a second preference from every voter and so an average tally of r per voter.
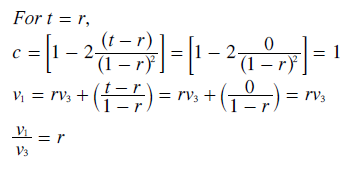
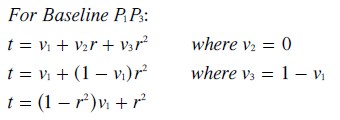
Notice that the relationship between the first and third preference shares can be simplified for the primary iso-tally line; see equation above. The ratio of first to third preference shares is now equal to the GV common ratio (r). The intercept of the primary iso-tally line with the P1P3 baseline is easily determined as the tally scale along it is linear; as demonstrated in the following analysis. The primary iso-tally line intercepts this linear scale (from r2 at apex P3 to 1 at apex P1) at r; since t = r for this line. This primary line is shown in bold on the above map.
Hence, t is proportional to v1 for any given r.
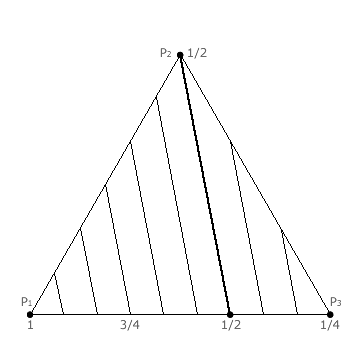
- The primary iso-tally grid line (where t = r) is a straight line between apex P2 and the point on the linear P1P3 baseline whose value is r.
Notice that the gradient (m) in the earlier general equation for any iso-tally line is only a function of r. Hence, for any given value of r, the gradient is fixed. This means that any iso-tally line has the same gradient as the primary one. In other words, the two lines are parallel. Therefore, the following statement is always true.
- Any secondary iso-tally grid line for tally t is parallel to the primary one and intercepts the linear P1P3 baseline at the point whose value is t.
Iso-tally grid lines for specified values of t can now be drawn on the map for a three-candidate GV election with a particular value of the common ratio (r). In the example CHPV (GV with r = 1/2) map opposite, iso-tally grid lines for values of t from 1/4 to 1 in steps of 1/12 are shown. The primary grid line where t = r = 1/2 is shown in bold.
Return to main text > Comparisons: Geometric Voting 4
Refer to > Mathematical Proofs: Table of Contents